Monitoring and Tracing provides real-time visibility into agent activity, execution health, and resource consumption. Traces are standardized with OpenTelemetry, which enables consistent log quality, advanced filtering, and high-fidelity reporting across all agents in your workspace. Org Owners and Admins have access to data across all users, enabling centralized oversight for teams managing multiple agents.

Analytics dashboard

The Analytics tab provides aggregate metrics across agents over a selected date range. Screenshot of the Analytics dashboard showing credit, latency, reliability, and token efficiency metrics with trend charts. Charts available:
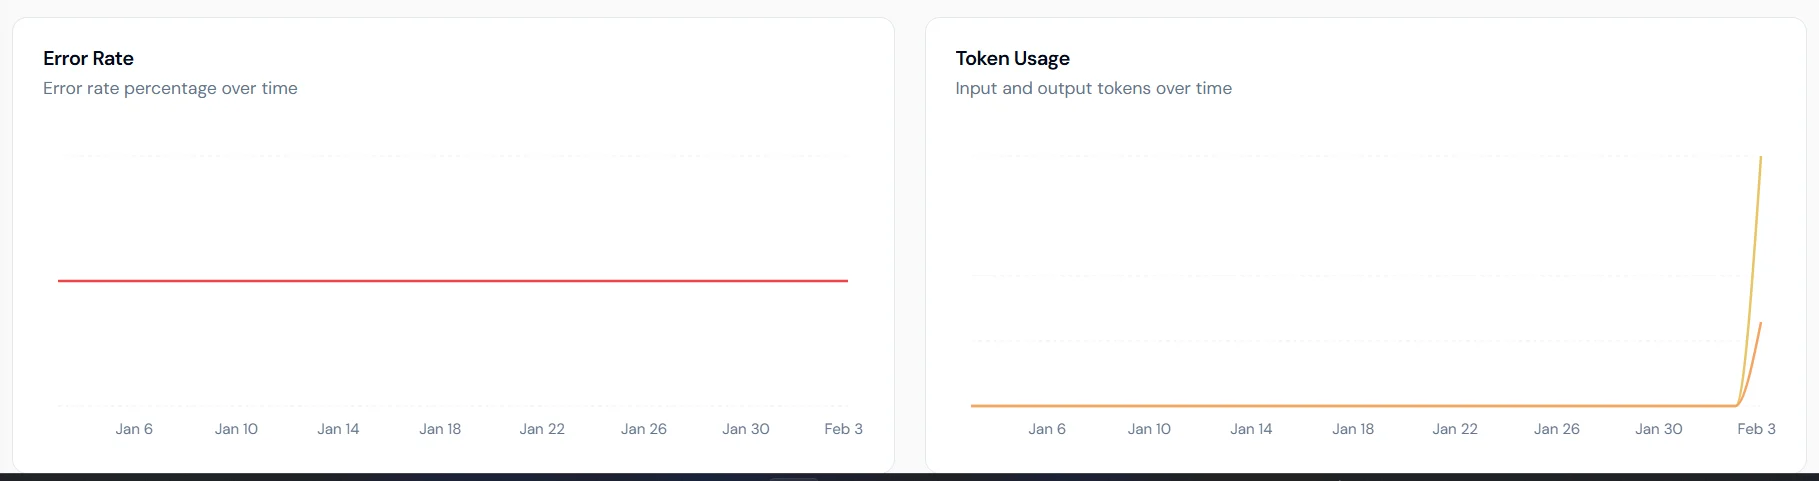
  • Error Rate: percentage of failed executions over time.
  • Token Usage: breakdown of input and output tokens.
  • Latency Trends: average and P95 latency to surface performance bottlenecks.
  • Credits Consumed: daily credit usage trends.

Traces

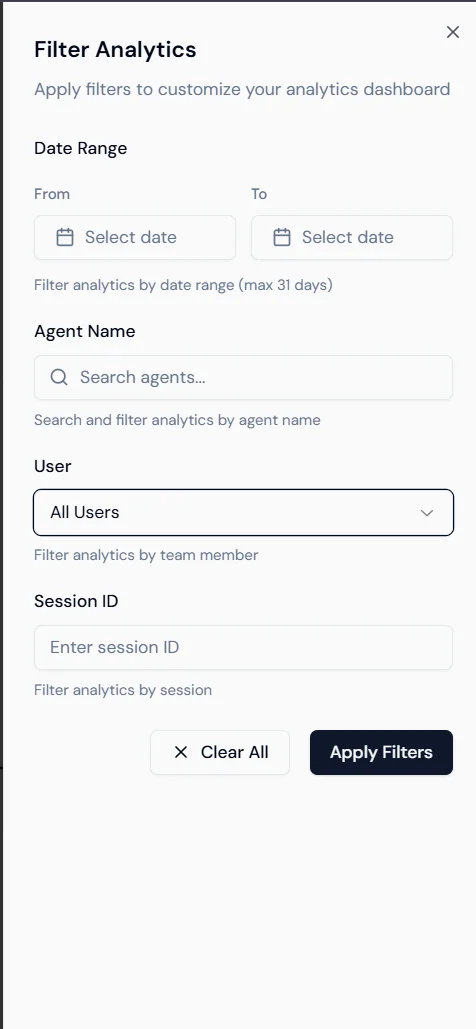
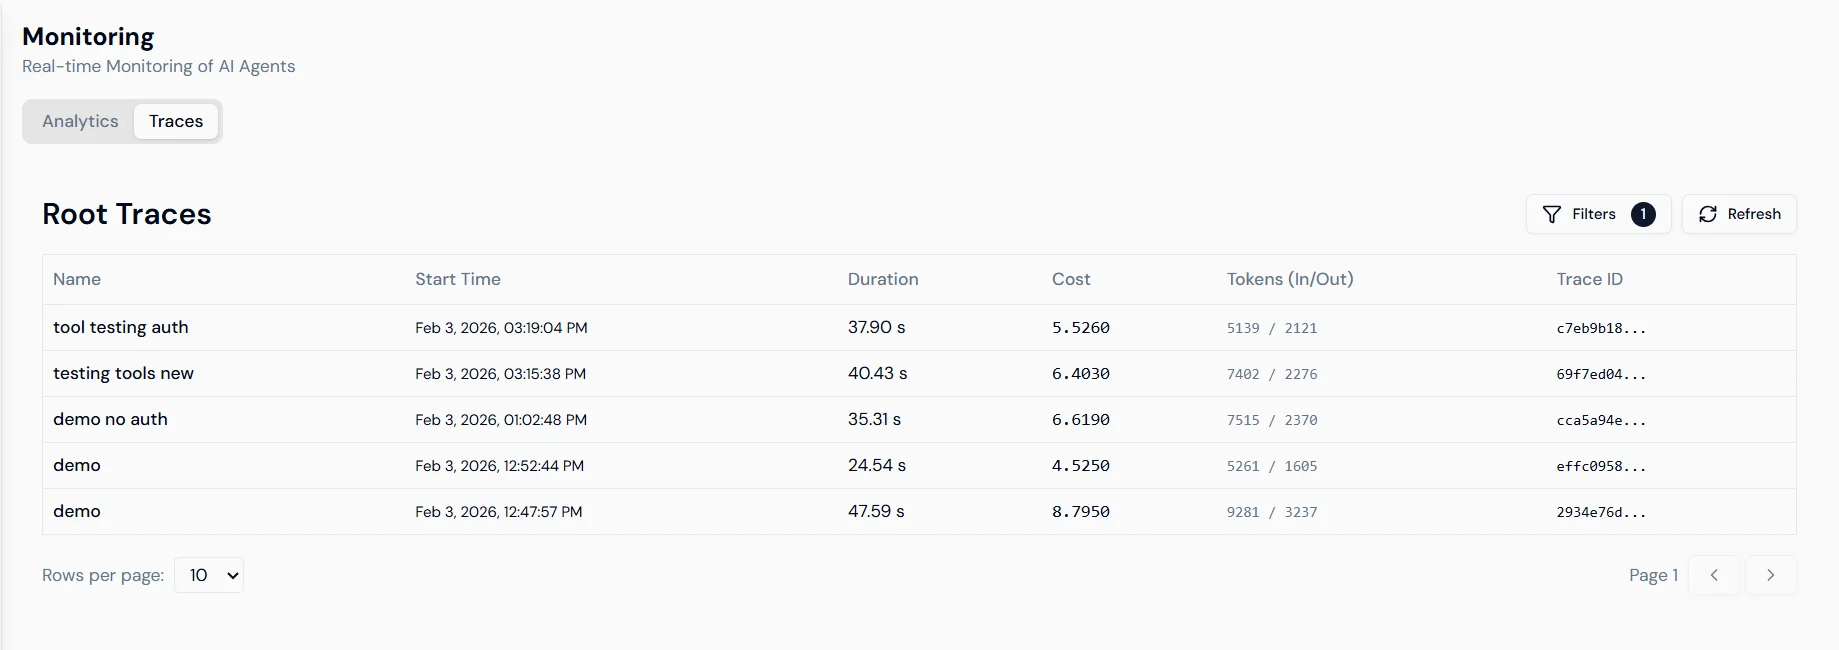
The Traces tab shows individual execution records for every agent run. Screenshot of the Traces list showing columns for Trace ID, Duration, Cost, Tokens, and Start Time. Each row shows: Trace ID, duration, cost and token consumption, and start time. Select any trace to open a detailed view. Filtering: Use the Filter Analytics sidebar to narrow traces by date range (up to 31 days), agent name, user, or session ID. Screenshot of the Filter Analytics sidebar with date range, agent name, user, and session ID filter options.
Trace detail

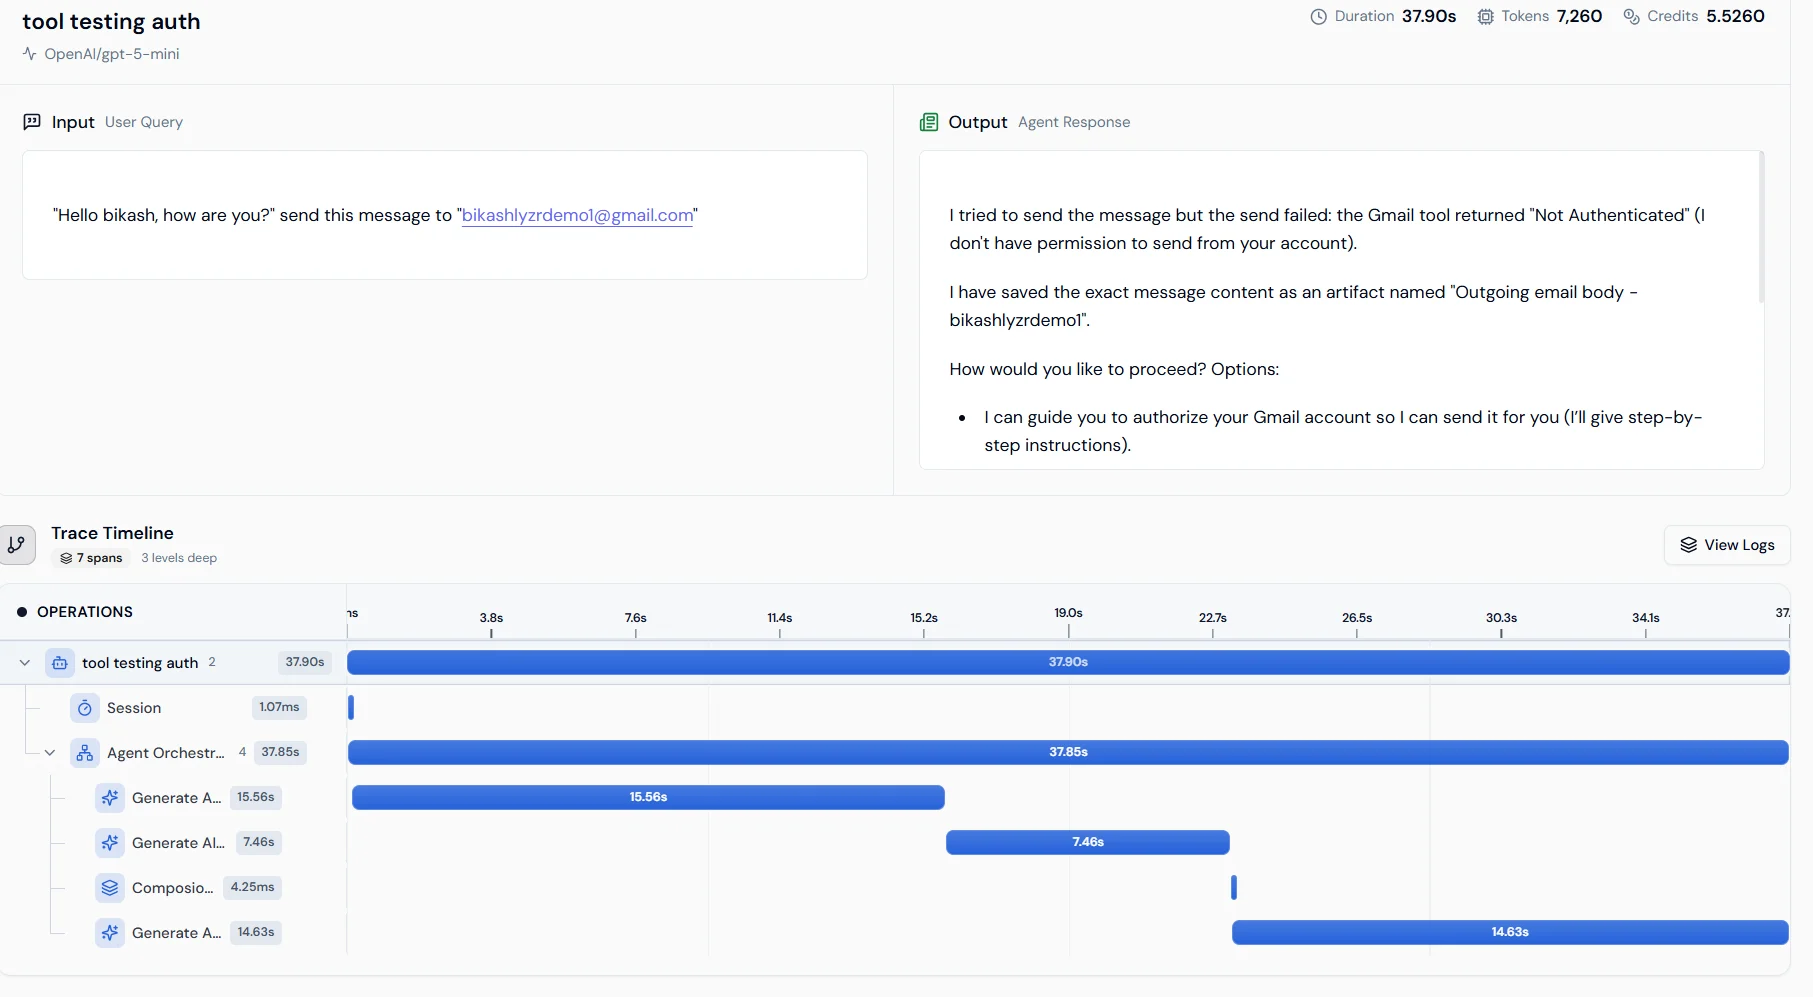
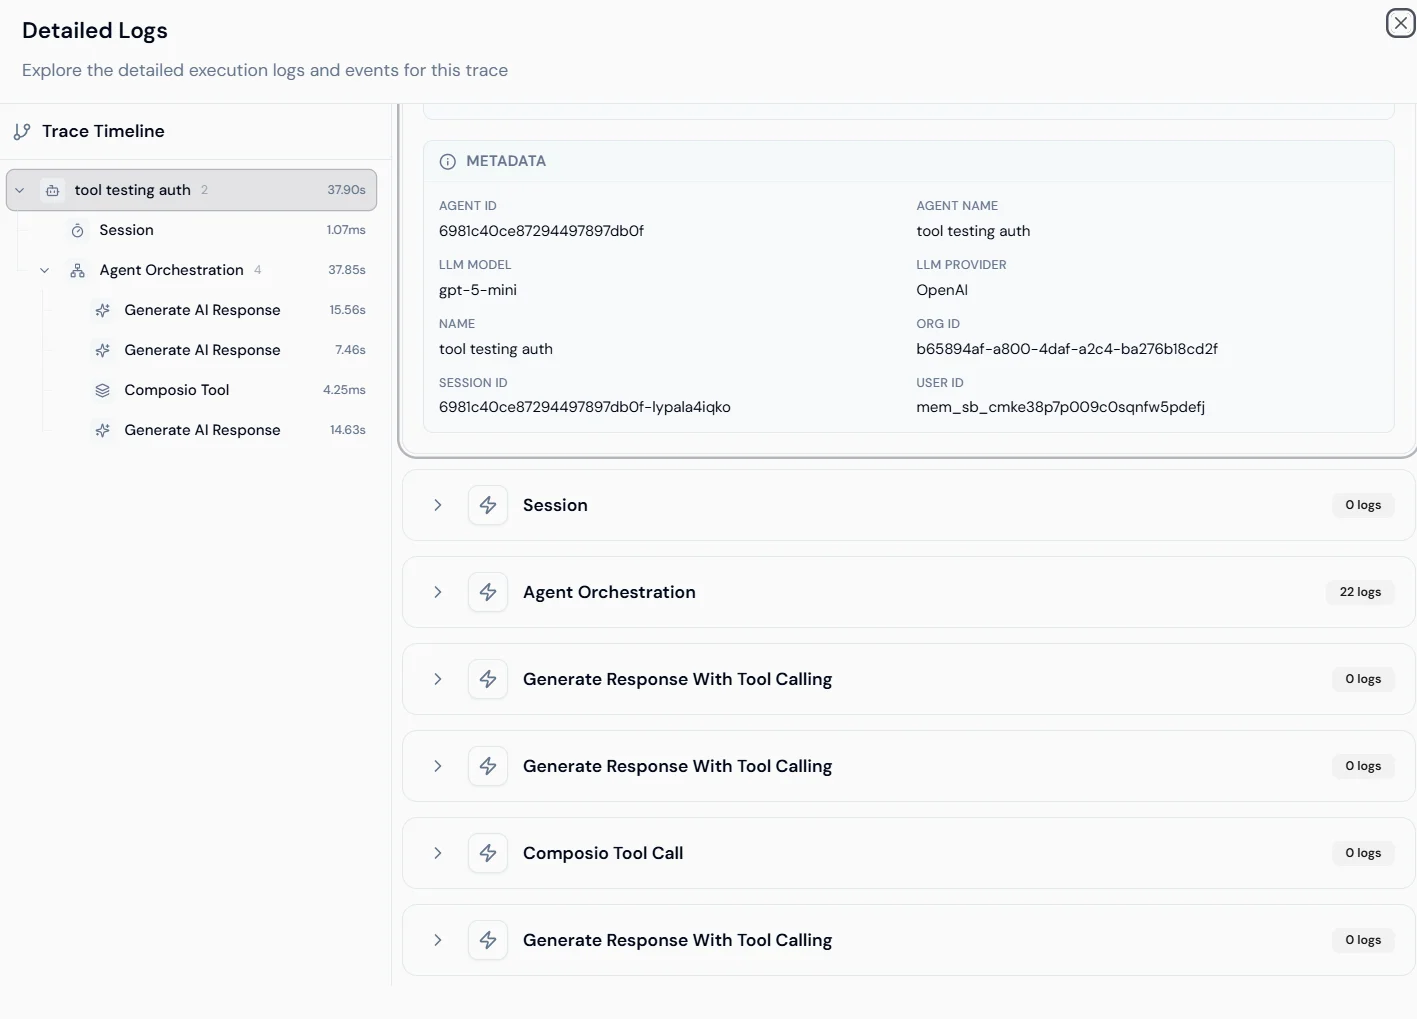
Selecting a trace opens the execution timeline for that run. Screenshot of the trace timeline view showing an operation waterfall from Session start through Agent Orchestration to Generate AI Response. Operation waterfall: shows the sequence of steps from session start through agent orchestration to the final LLM response, with duration for each span. This identifies which step is causing latency. Metadata and logs: shows Agent ID, Org ID, User ID, and model details. Expand any operation to view raw logs and internal event data. Screenshot of the detailed logs panel showing metadata fields and expandable operation logs.
Generate insights for a trace

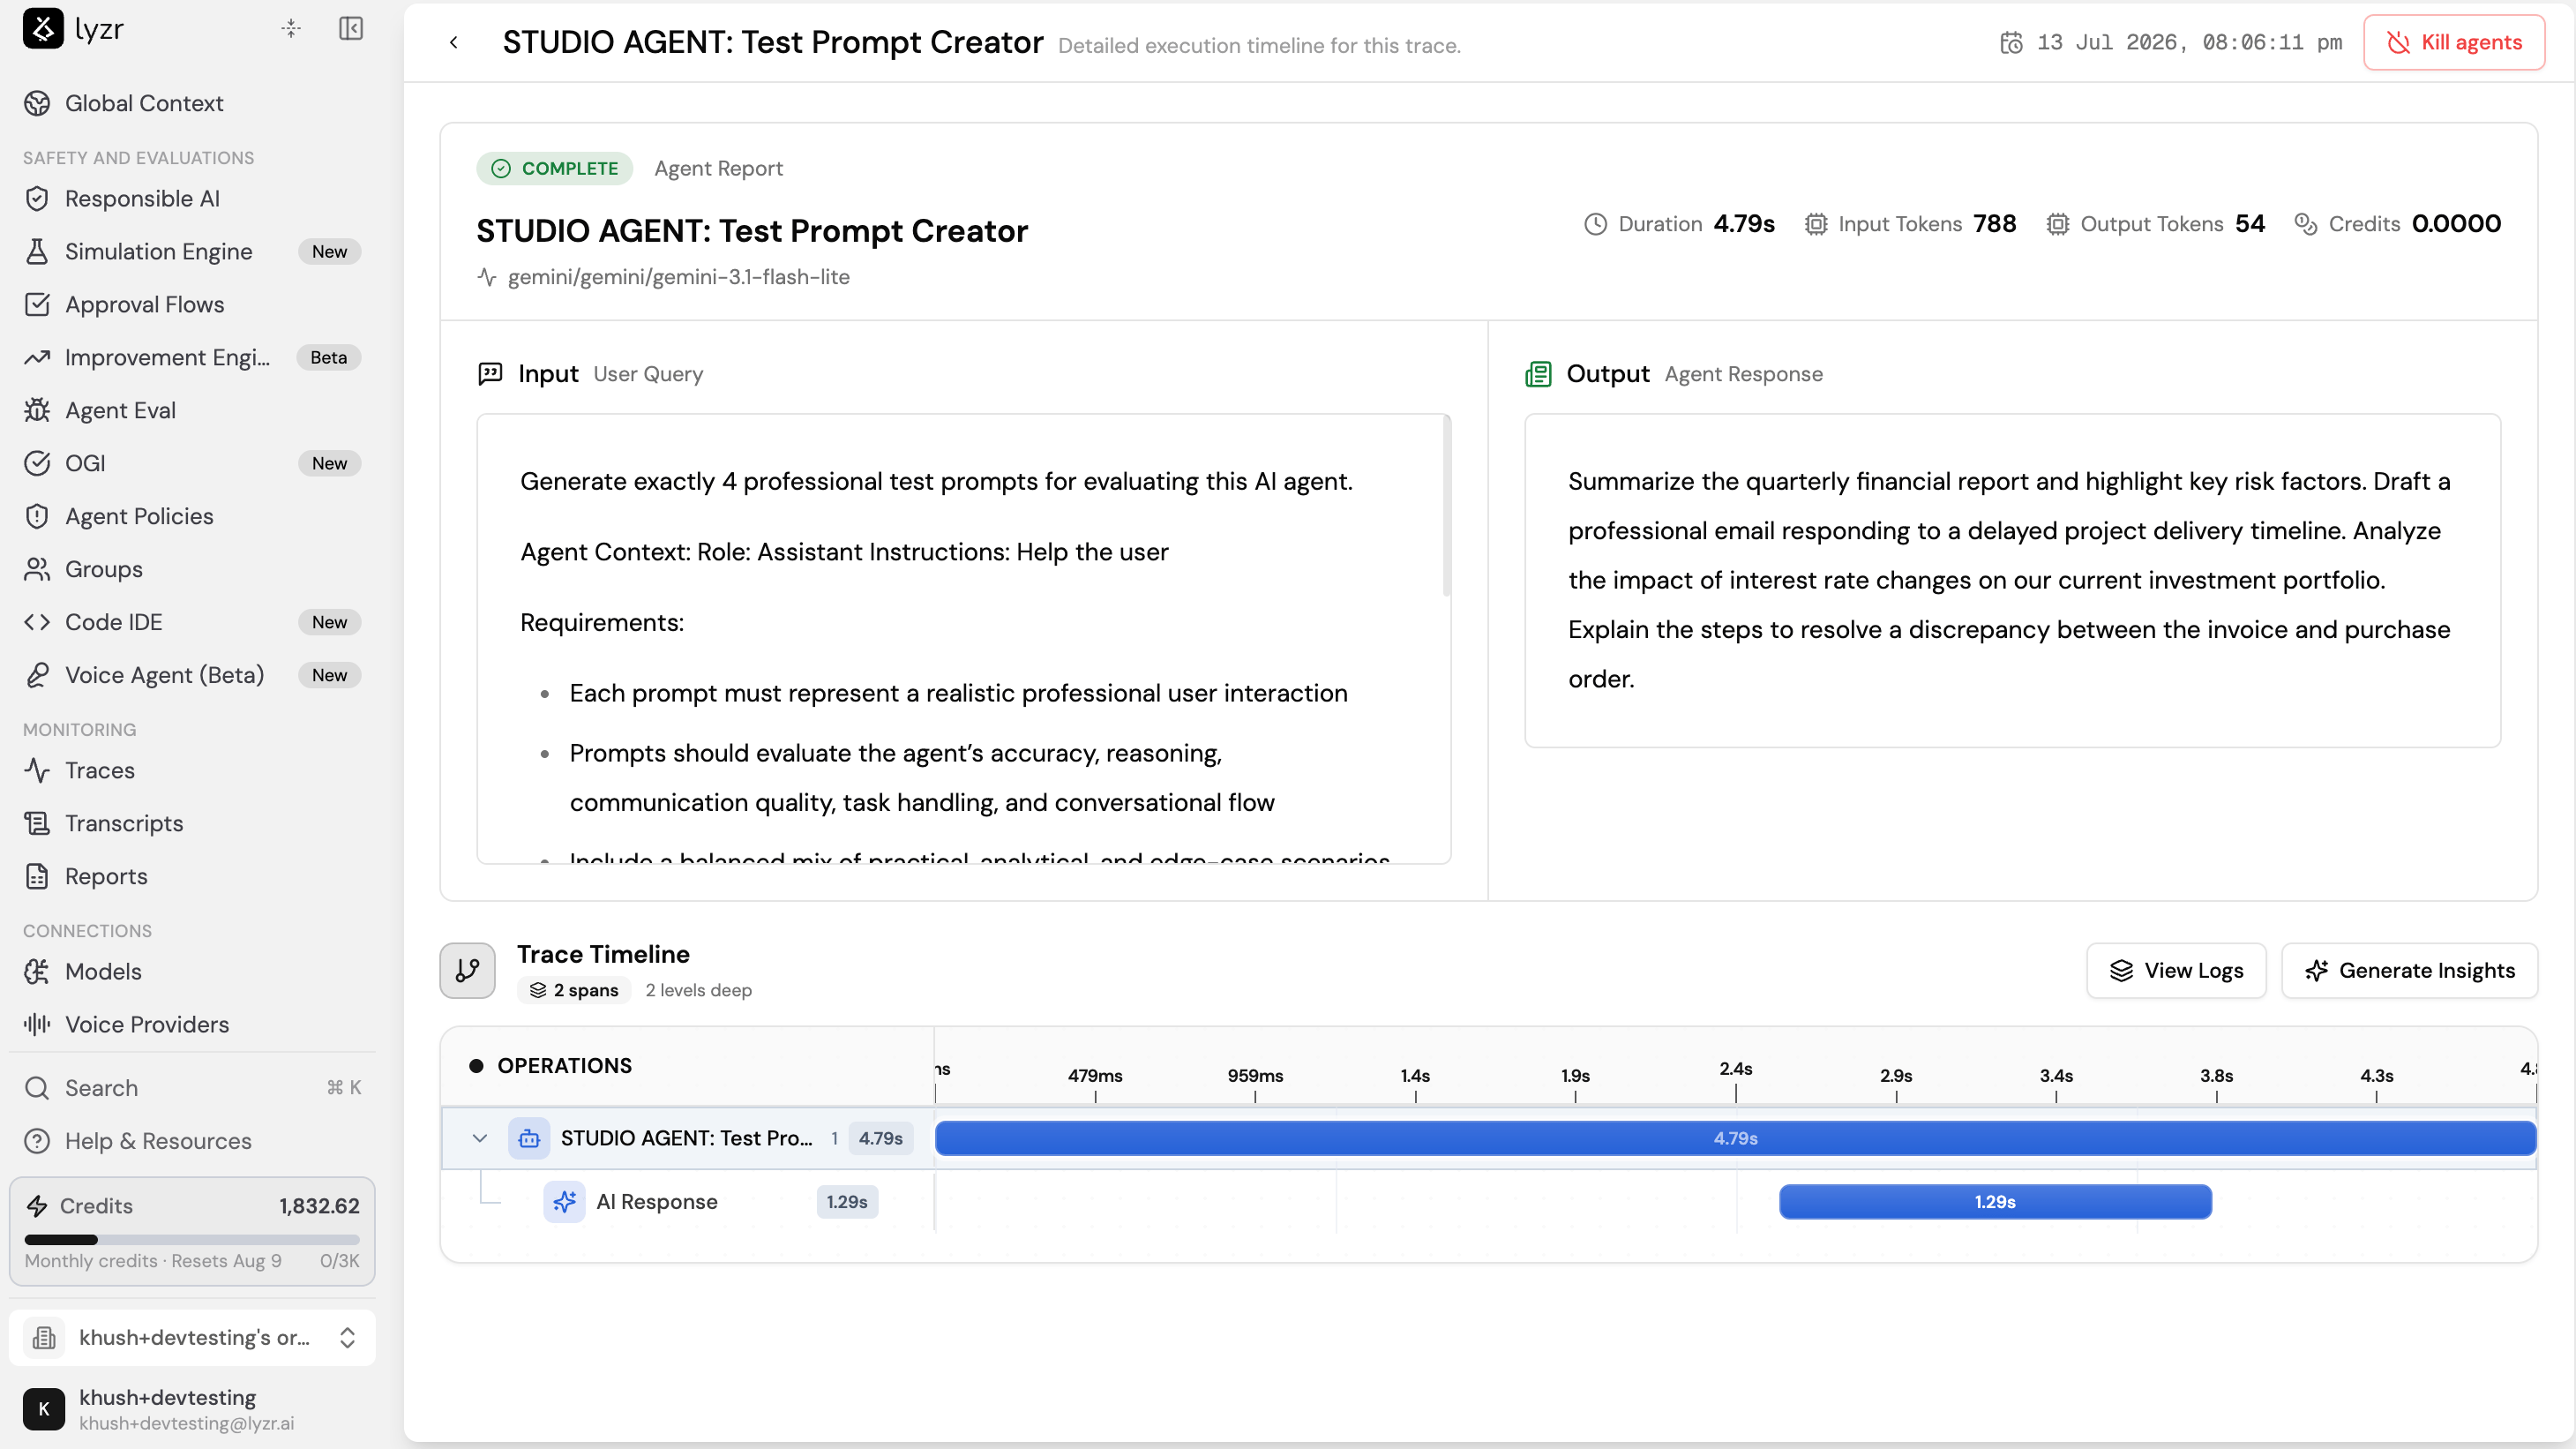
Each trace detail view has a Generate Insights action that runs a utility agent over the trace and returns a structured review of that run. Use it to understand a long or failed execution quickly, without reading every span in the operation waterfall by hand. The trace detail view showing the Generate Insights button above the Trace Timeline. The insights come back in two parts:
  • Trace Verdict states which agent ran, what the user asked for, what the agent delivered, and an overall verdict on whether the request was fulfilled.
  • Findings lists each behavior the utility agent identified, numbered and tagged with a status such as Worked. Each finding describes what happened and its impact on the output.

Next steps