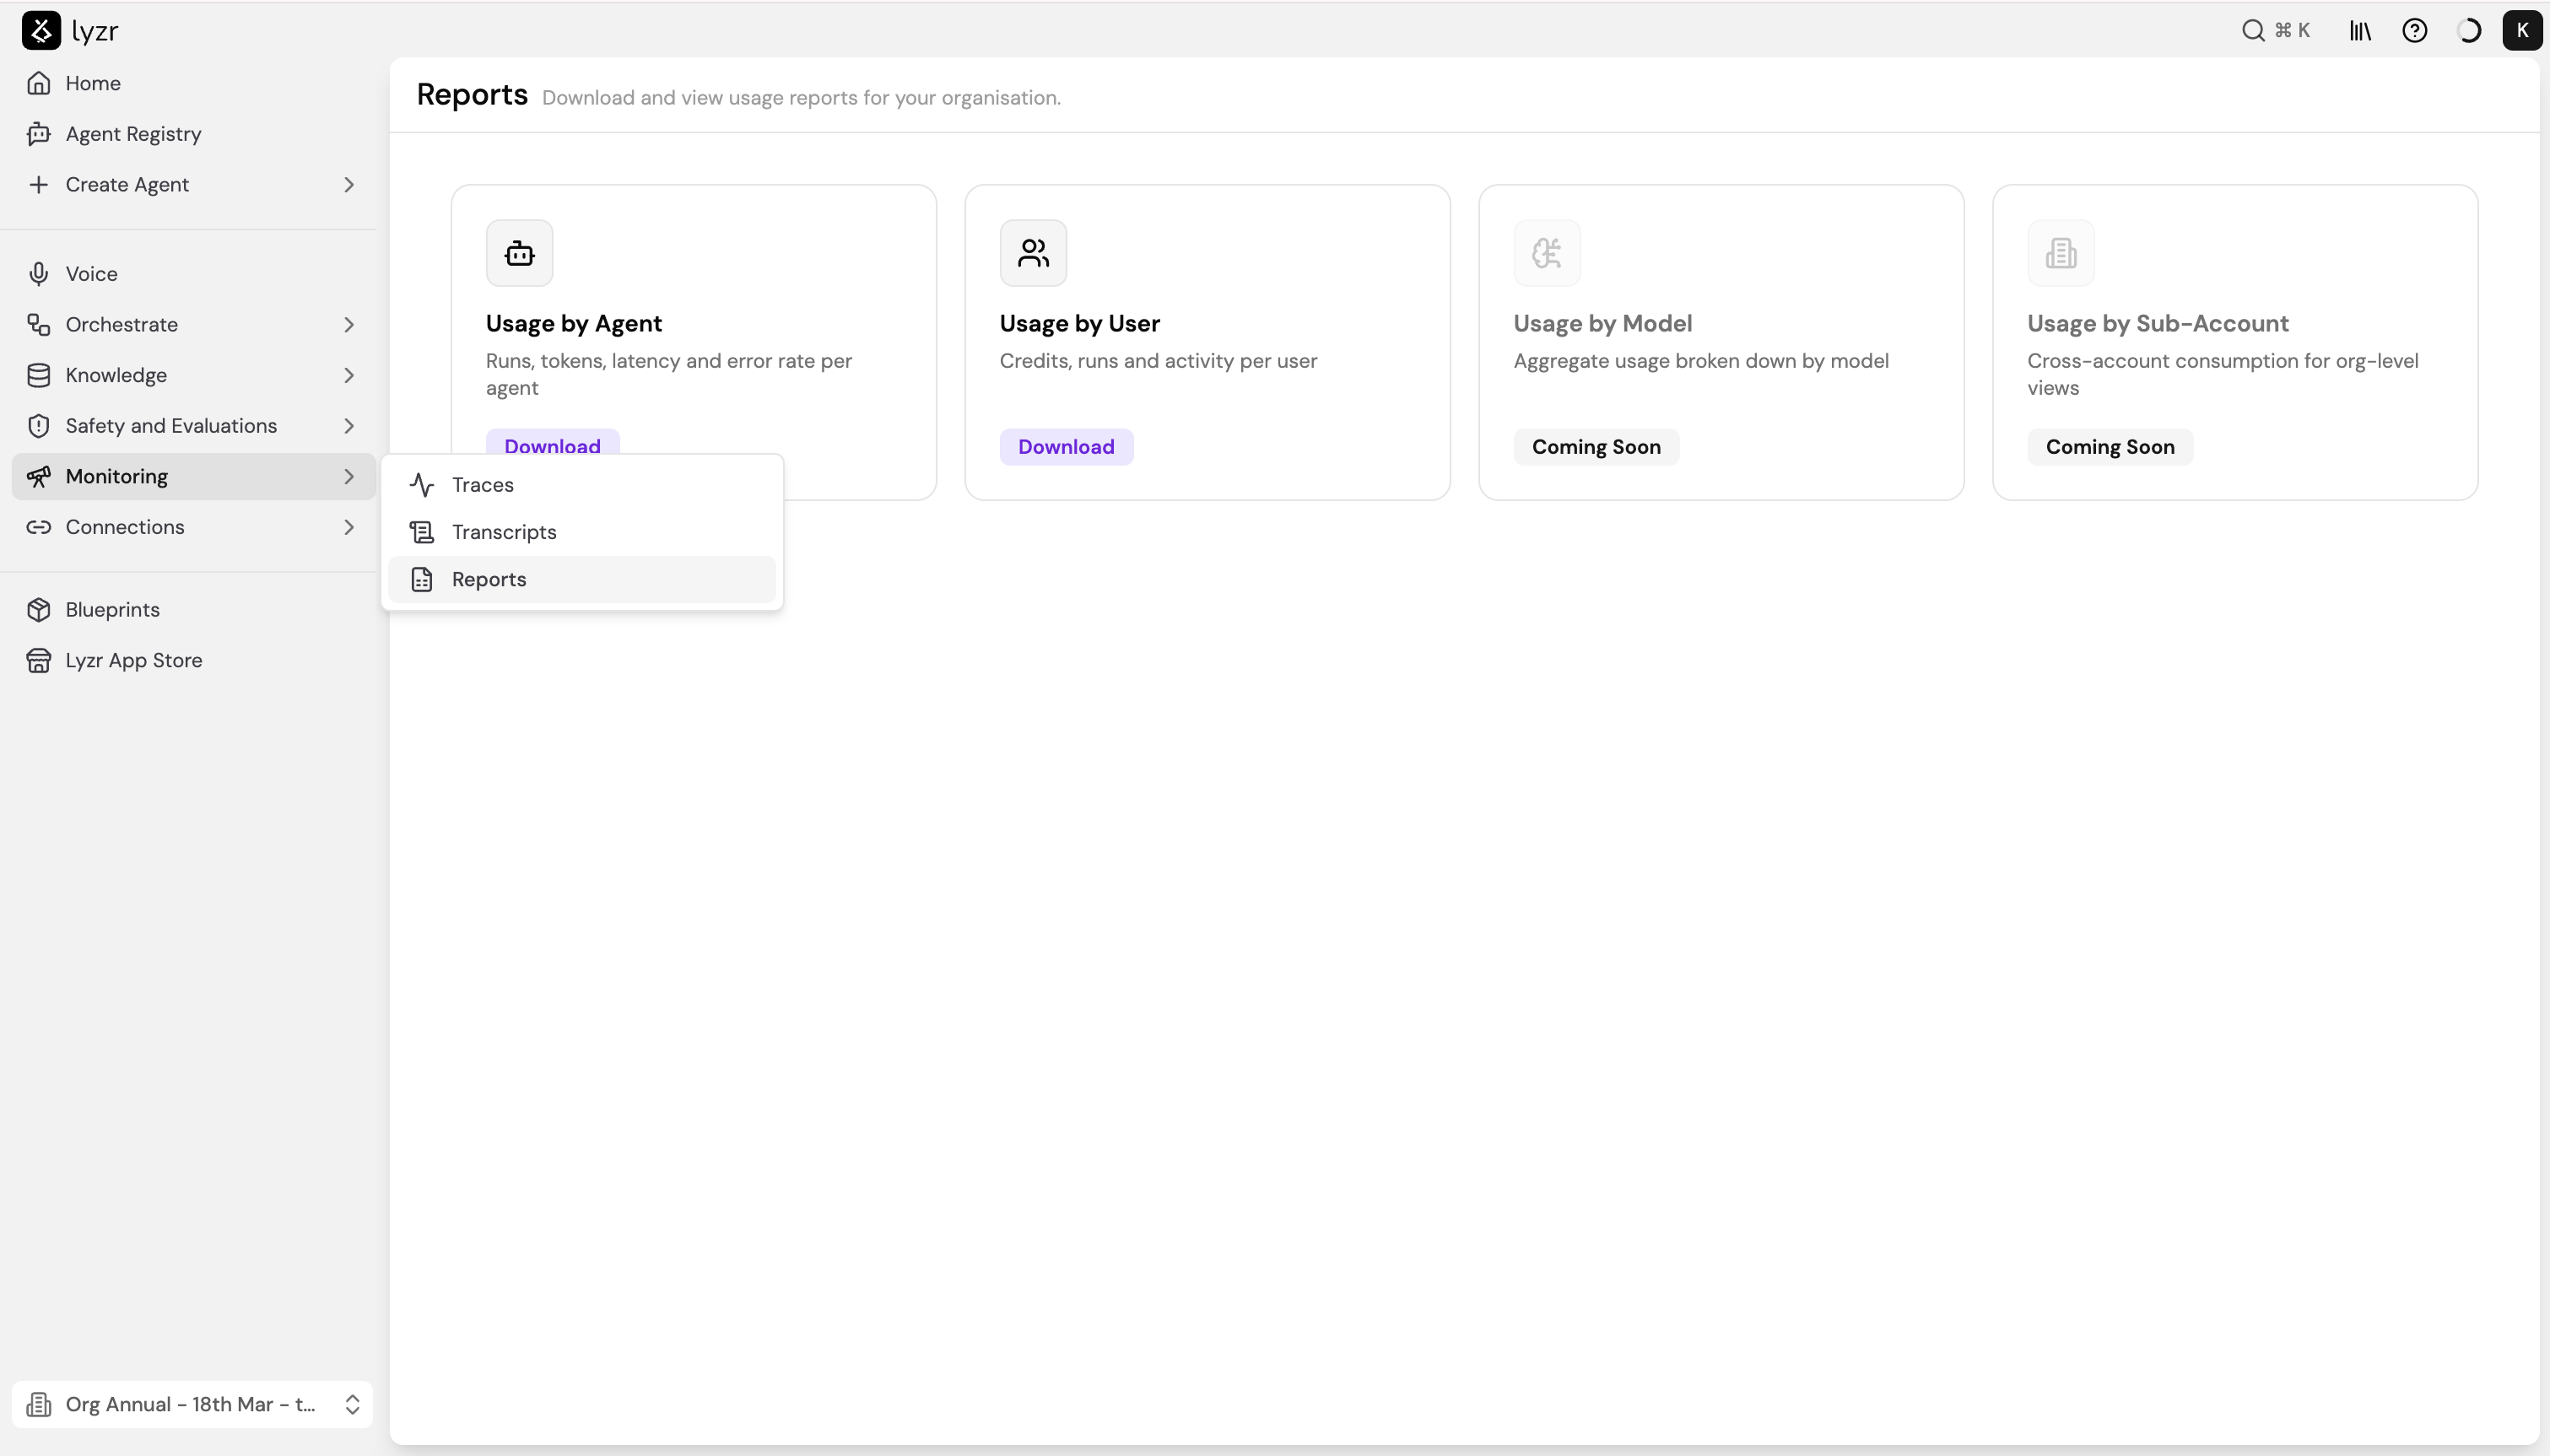
Reports lets you export usage data for your organisation as CSV files. Access it via Monitoring > Reports from the sidebar. Each report type focuses on a different dimension of usage - by agent, by user, or by model. Reports overview showing Usage by Agent, Usage by User, Usage by Model and Usage by Sub-Account cards

Available reports

ReportWhat it coversStatus
Usage by AgentRuns, tokens, latency, and error rate per agentAvailable
Usage by UserCredits, runs, and activity per userAvailable
Usage by ModelAggregate usage broken down by modelComing soon
Usage by Sub-AccountCross-account consumption for org-level viewsComing soon

Usage by Agent

Breaks down agent performance and consumption over a selected time period. Use this report to identify high-traffic agents, spot latency outliers, and track error rates across your agent fleet. To generate the report:
  1. Select Download on the Usage by Agent card.
  2. Choose a Timeframe - this field is required.
  3. Optionally filter by Agent Type, Model, or Created By.
  4. Select Download. The report downloads as a CSV file.
Filters:
FilterOptions
TimeframeThis week, This month, Last week, Last month, Last 7 days, Last 30 days, Last 3 months, Last 6 months, Last 12 months
Agent TypeAll agent types, or filter to a specific type (e.g. single_task)
ModelAll models, or filter to a specific model
Created ByAnyone, or filter to a specific team member
The exported CSV includes one row per agent with the following columns:
ColumnDescription
agent_nameDisplay name of the agent
agent_idUnique identifier for the agent
model_usedThe LLM the agent ran on
agent_typeType of agent (e.g. single_task)
total_runsTotal number of runs in the selected timeframe
total_sessionsTotal number of sessions in the selected timeframe
avg_runs_per_sessionAverage runs per session
credits_consumedTotal credits consumed
input_tokens_totalTotal input tokens across all runs
output_tokens_totalTotal output tokens across all runs
avg_latency_msAverage response latency in milliseconds
p95_latency_ms95th percentile latency - the latency below which 95% of runs fall
error_rateProportion of runs that resulted in an error

Usage by User

Shows credit consumption, run counts, and activity broken down by user. Use this report to understand how usage is distributed across your team and track credit spend per person. To generate the report:
  1. Select Download on the Usage by User card.
  2. Choose a Timeframe - this field is required.
  3. Toggle Include sub-organisations if you want to roll up usage from child organisations into the report.
  4. Select Download. The report downloads as a CSV file.
The exported CSV includes one row per user with the following columns:
ColumnDescription
user_emailEmail address of the user
roleThe user’s role in the organisation
user_idUnique identifier for the user
total_runsTotal number of agent runs triggered by the user
agents_createdNumber of agents created by the user
credits_consumedTotal credits consumed
input_tokens_totalTotal input tokens across all runs
output_tokens_totalTotal output tokens across all runs

Coming soon

Usage by Model and Usage by Sub-Account are currently in development.
  • Usage by Model will show aggregate token consumption and cost broken down by model, making it easier to compare spend across providers.
  • Usage by Sub-Account will provide org-level views of cross-account consumption, useful for teams managing multiple sub-organisations under one parent account.

Next steps