Key Features
- Comprehensive Logging: Every action taken on the platform is recorded—from agent modifications to knowledge base uploads—to assist with activity oversight and forensic auditing.
- Access Control: Due to the sensitive nature of the data, this feature is strictly restricted to users with Admin or Owner roles.
- Real-time Monitoring: Use the Refresh button to pull the latest events, and the Pagination (e.g., “Page 1 of 5”) to review historical logs.
Navigation and Access
To access the Audit Logs, follow these steps:-
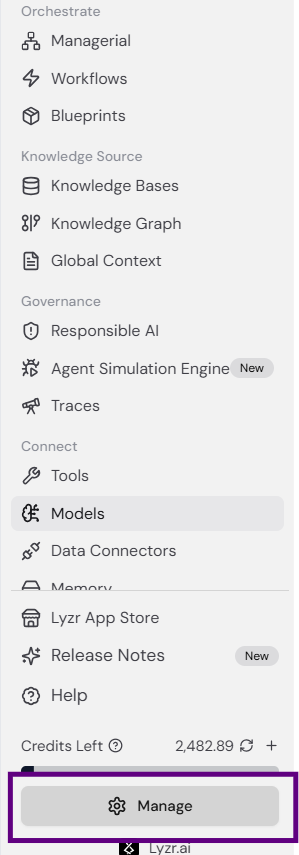
Click the Manage button at the bottom of the left-hand sidebar.
-
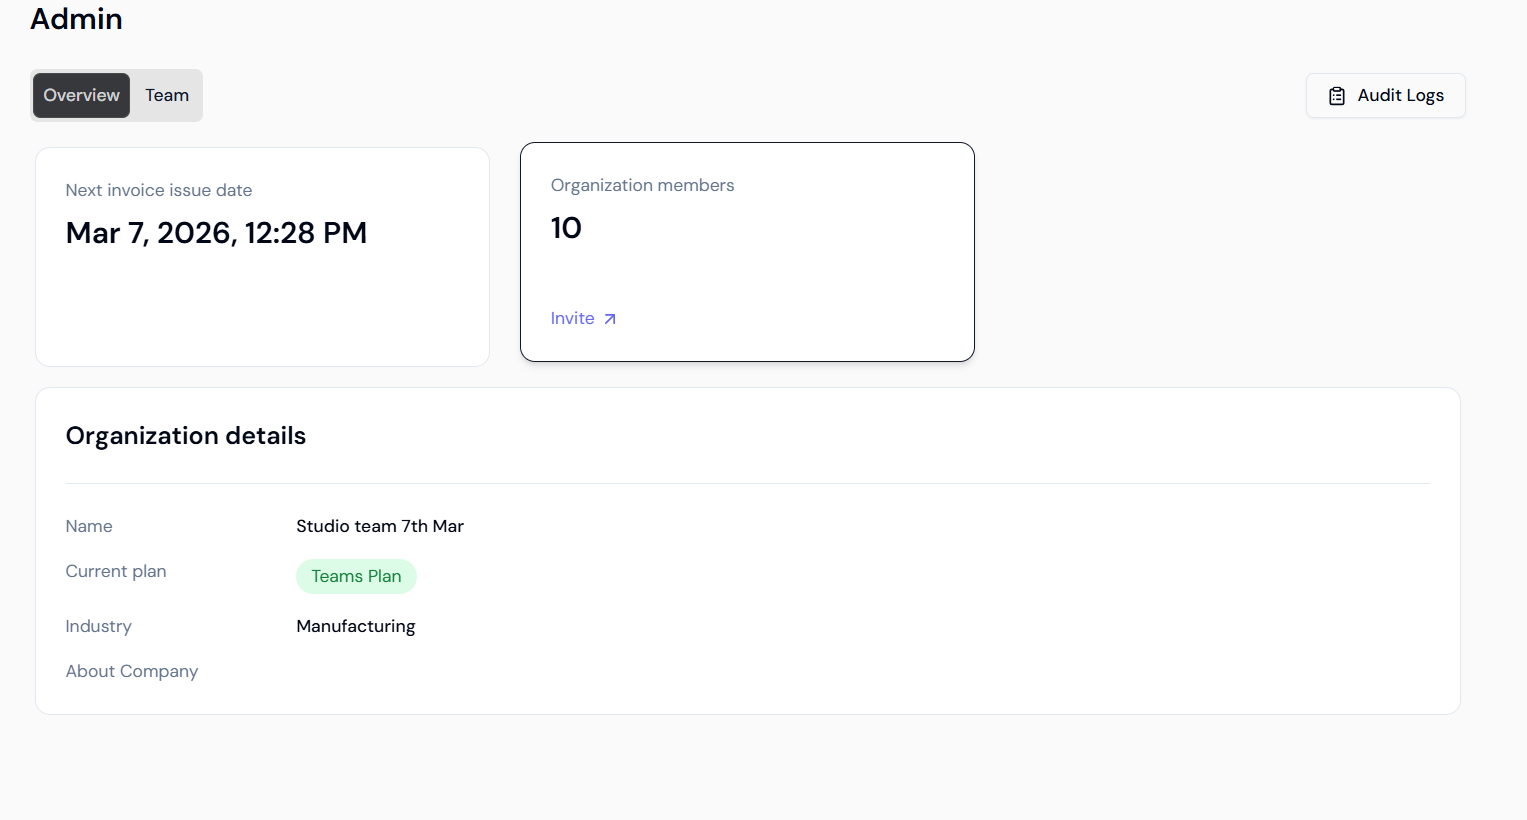
You will be redirected to the Admin dashboard. In the top right corner of the Overview tab, click the Audit Logs button.
Dashboard Overview
The Audit Log interface provides high-level metrics and granular details to help you reconstruct specific events:- Total Events: Total count of logged activities (e.g., “Showing 1 - 50 of 201 results”).
- Event Status: Tracking of Successful vs. Failed actions to identify system errors or unauthorized attempts.
- Events by Action: Breakdown of activities such as Create, Update, and Delete.
- Events by Resource: Monitoring of activities across different resources like Agents, Tools, and Knowledge Bases.
Activity Log Details
The granular log table captures specific data points for every entry to provide a full context of the activity: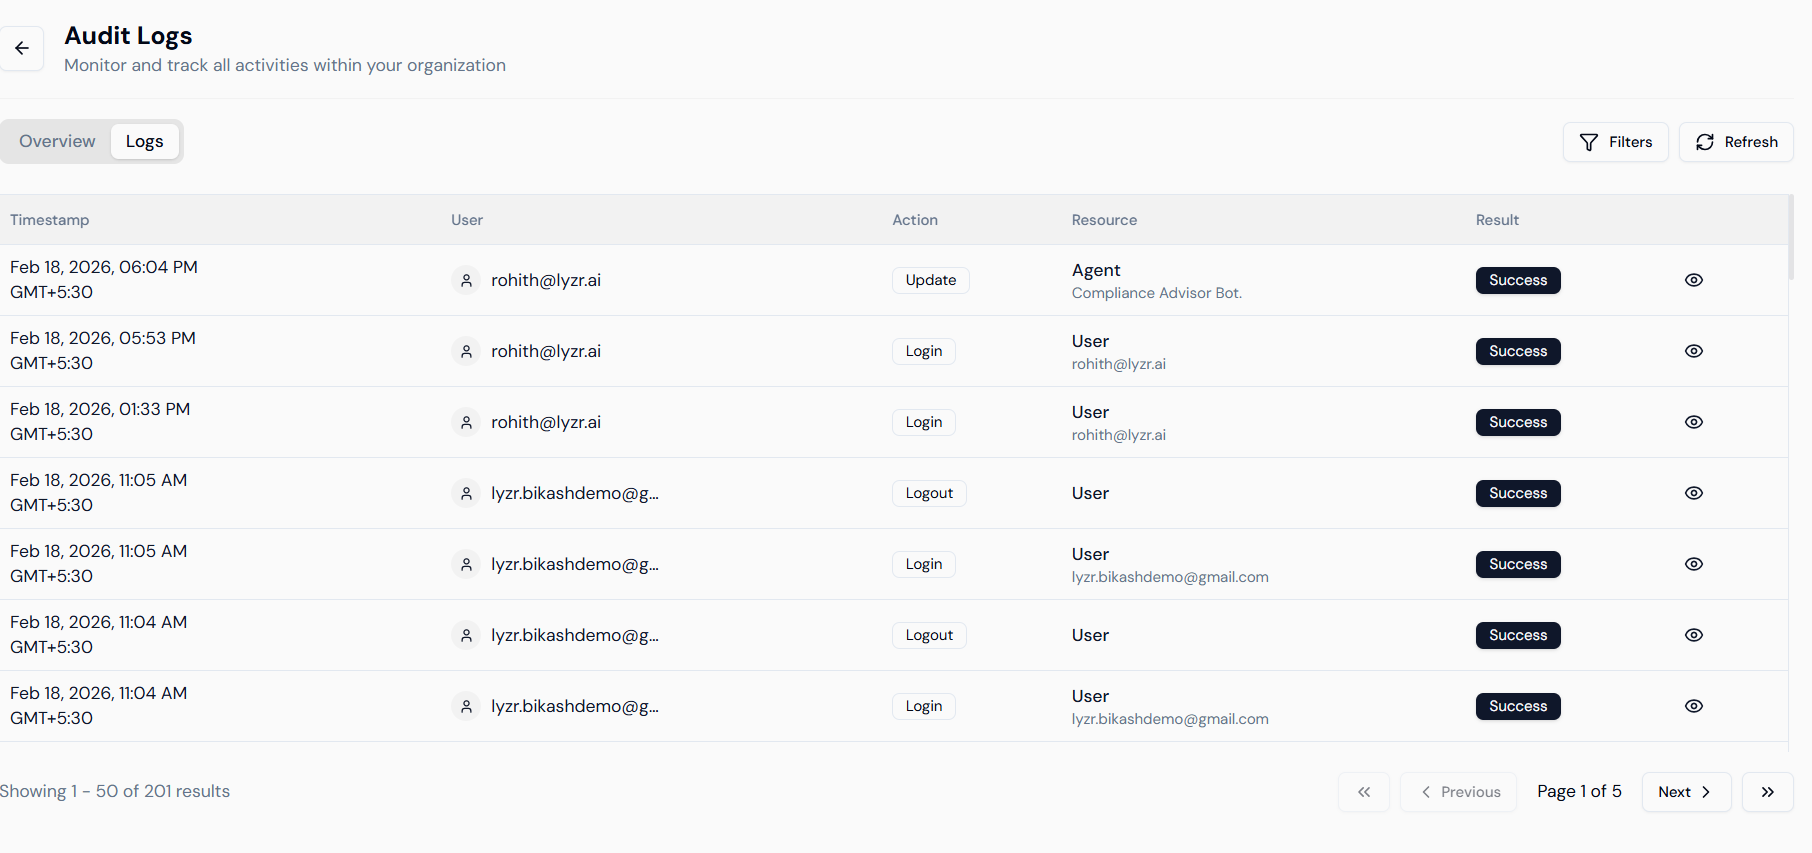
- Timestamp: The exact date and time of the event, including time zone offsets (e.g., Feb 18, 2026, 06:04 PM GMT+5:30).
- User: Identification of the member who performed the action, displayed by their registered email address.
- Action: The specific operation executed (e.g., “Update”, “Login”, “Logout”).
- Resource: The specific entity or platform component affected (e.g., “Agent” or “Compliance Advisor Bot”).
- Result: Confirmation of the outcome, such as “Success”, “Failure”, “Blocked”, or “Partial”.
- Metadata View: The eye icon on the far right allows you to view the raw JSON or technical details of the event.
Filtering and Refining Search
With high volumes of events, finding a specific change requires using the Filters tool to narrow down the results.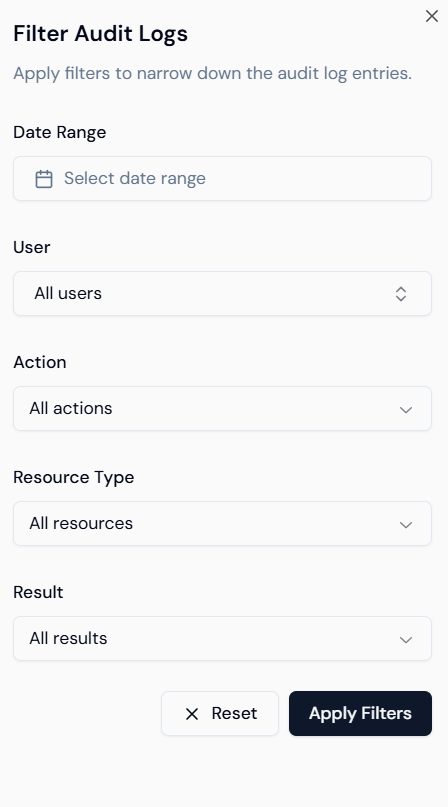
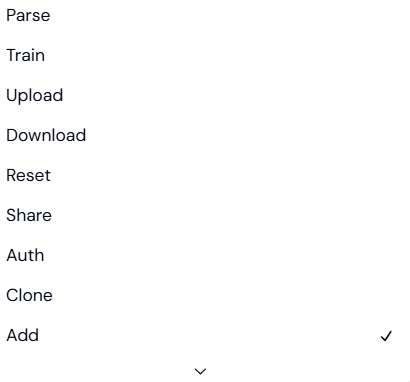
1. Filtering by Action
Narrow your search based on the type of behavior performed on the platform.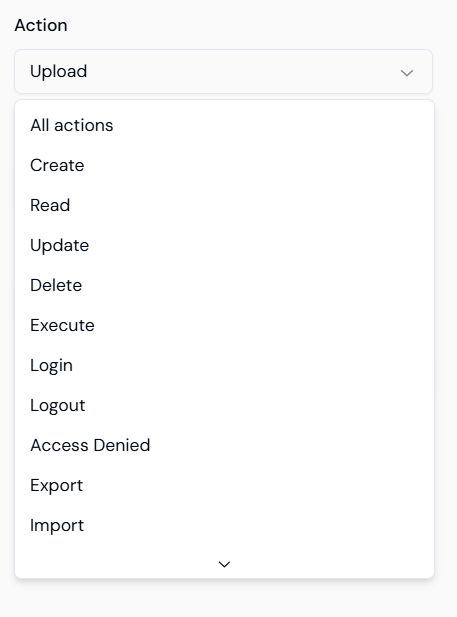
- Management: Create, Read, Update, Delete.
- Security: Login, Logout, Access Denied, Auth.
- AI Operations: Train, Parse, Execute, Inference.
- Data Flow: Upload, Download, Export, Import, Add.
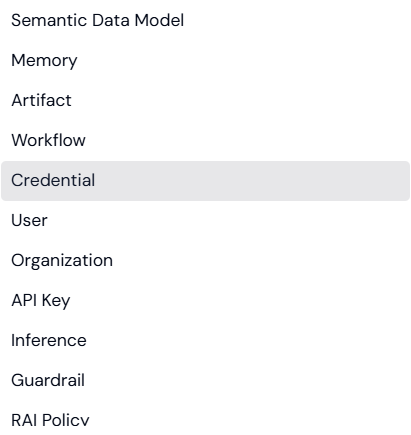
2. Filtering by Resource Type
Filter by the specific component of the platform to see how certain assets are being handled.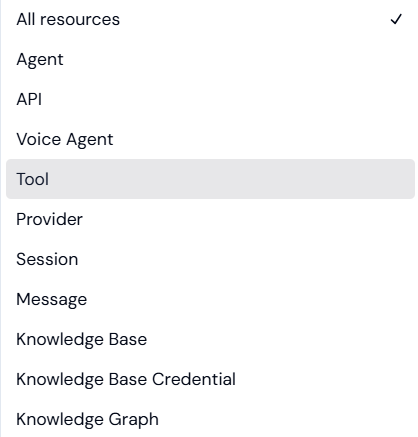
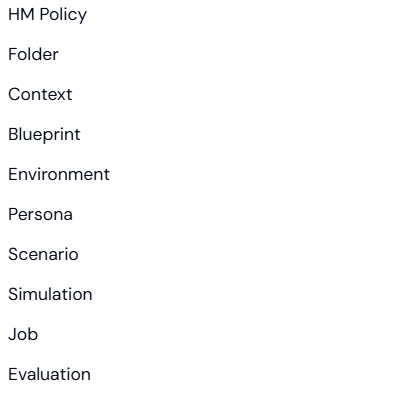
- Core Components: Agent, Voice Agent, Tool, Knowledge Base.
- Infrastructure: Organization, User, API Key, Environment, Folder.
- AI Logic: Semantic Data Model, Knowledge Graph, Memory, Guardrail, RAI/HM Policy.
- Simulation & Testing: Persona, Scenario, Simulation, Evaluation.
3. Filtering by Result
Isolate entries based on their final status to troubleshoot issues.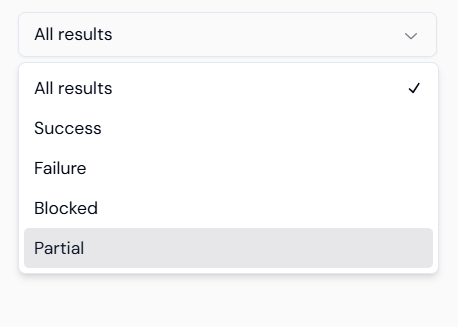
- Success: The operation was completed successfully.
- Failure: The operation encountered an error.
- Blocked: The action was stopped by security protocols or lack of permissions.
- Partial: Only a portion of the request was fulfilled.