> ## Documentation Index
> Fetch the complete documentation index at: https://docs.lyzr.ai/llms.txt
> Use this file to discover all available pages before exploring further.
# Monitoring & Tracing
> Real-time insights into agent usage, performance, latency, and credit consumption via OpenTelemetry-standardized traces.
Monitoring and Tracing provides real-time visibility into agent activity, execution health, and resource consumption. Traces are standardized with OpenTelemetry, which enables consistent log quality, advanced filtering, and high-fidelity reporting across all agents in your workspace.
Org Owners and Admins have access to data across all users, enabling centralized oversight for teams managing multiple agents.
## Analytics dashboard
The Analytics tab provides aggregate metrics across agents over a selected date range.
| Metric | Description |
| ----------------- | --------------------------------------------------------- |
| Total Credits | Aggregate credits spent, including average cost per trace |
| Avg Latency | Mean agent response time in seconds |
| Reliability Score | Percentage of successful executions |
| Token Efficiency | Average tokens used per trace |
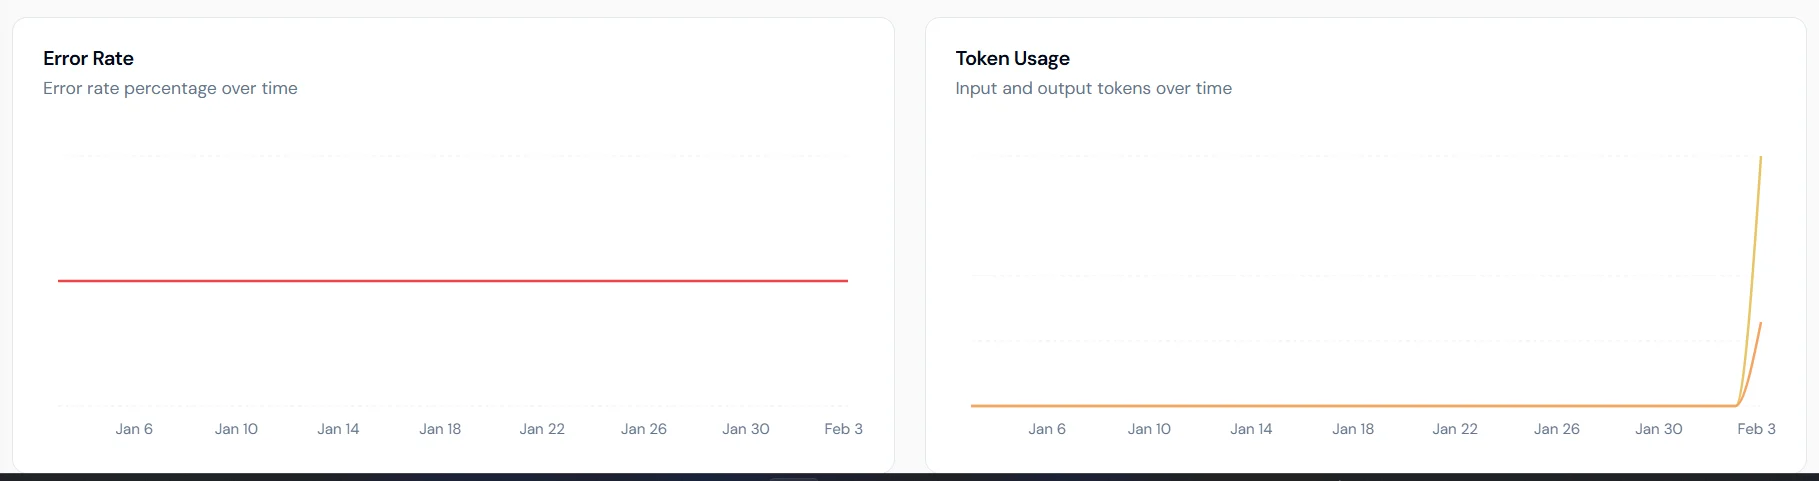 **Charts available:**
* **Error Rate**: percentage of failed executions over time.
* **Token Usage**: breakdown of input and output tokens.
* **Latency Trends**: average and P95 latency to surface performance bottlenecks.
* **Credits Consumed**: daily credit usage trends.
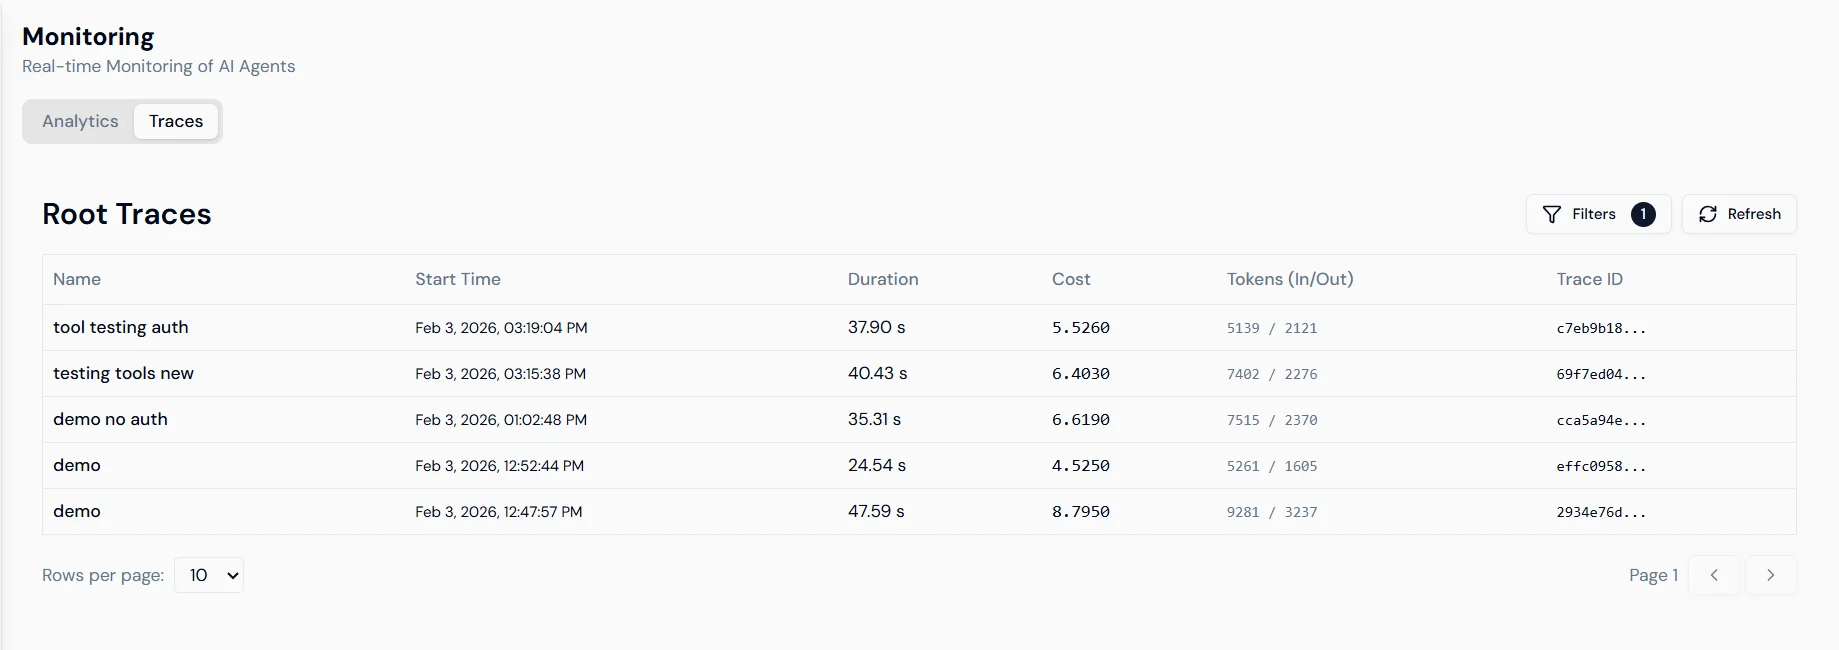
## Traces
The Traces tab shows individual execution records for every agent run.
**Charts available:**
* **Error Rate**: percentage of failed executions over time.
* **Token Usage**: breakdown of input and output tokens.
* **Latency Trends**: average and P95 latency to surface performance bottlenecks.
* **Credits Consumed**: daily credit usage trends.
## Traces
The Traces tab shows individual execution records for every agent run.
 Each row shows: Trace ID, duration, cost and token consumption, and start time. Select any trace to open a detailed view.
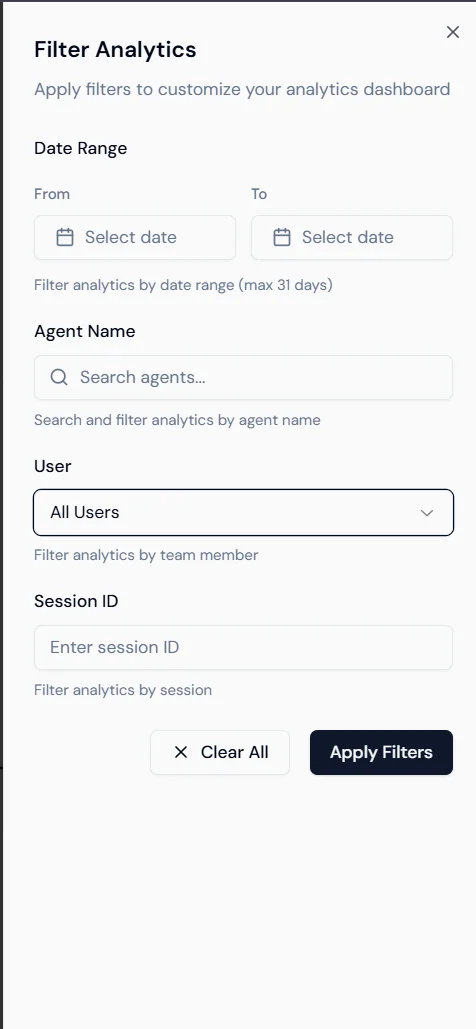
**Filtering:** Use the Filter Analytics sidebar to narrow traces by date range (up to 31 days), agent name, user, or session ID.
Each row shows: Trace ID, duration, cost and token consumption, and start time. Select any trace to open a detailed view.
**Filtering:** Use the Filter Analytics sidebar to narrow traces by date range (up to 31 days), agent name, user, or session ID.
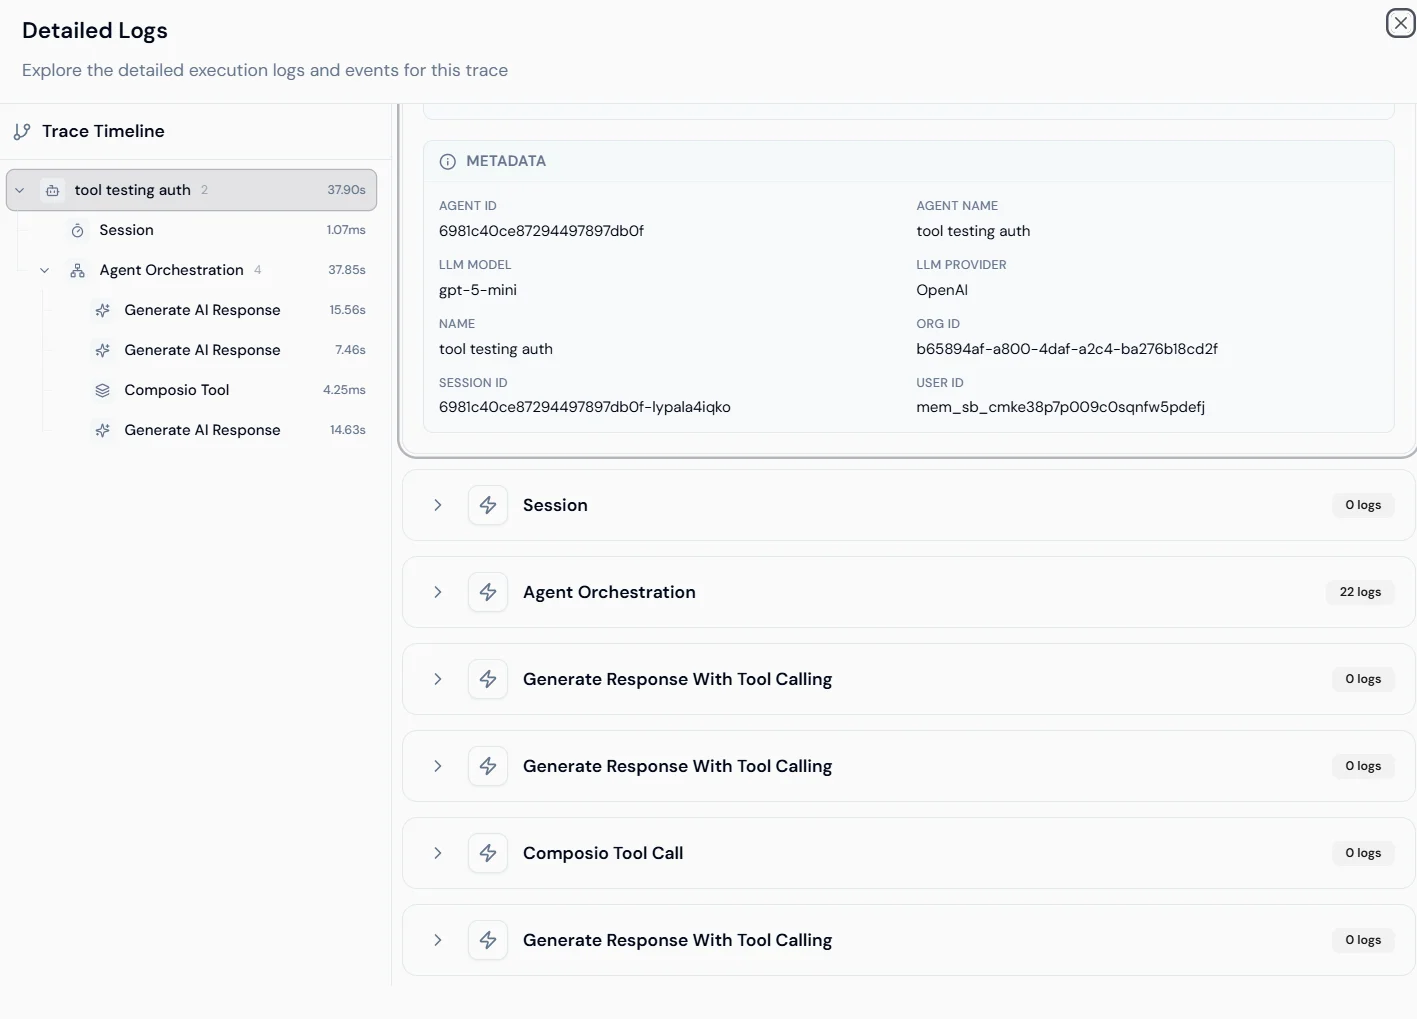
 ## Trace detail
Selecting a trace opens the execution timeline for that run.
## Trace detail
Selecting a trace opens the execution timeline for that run.
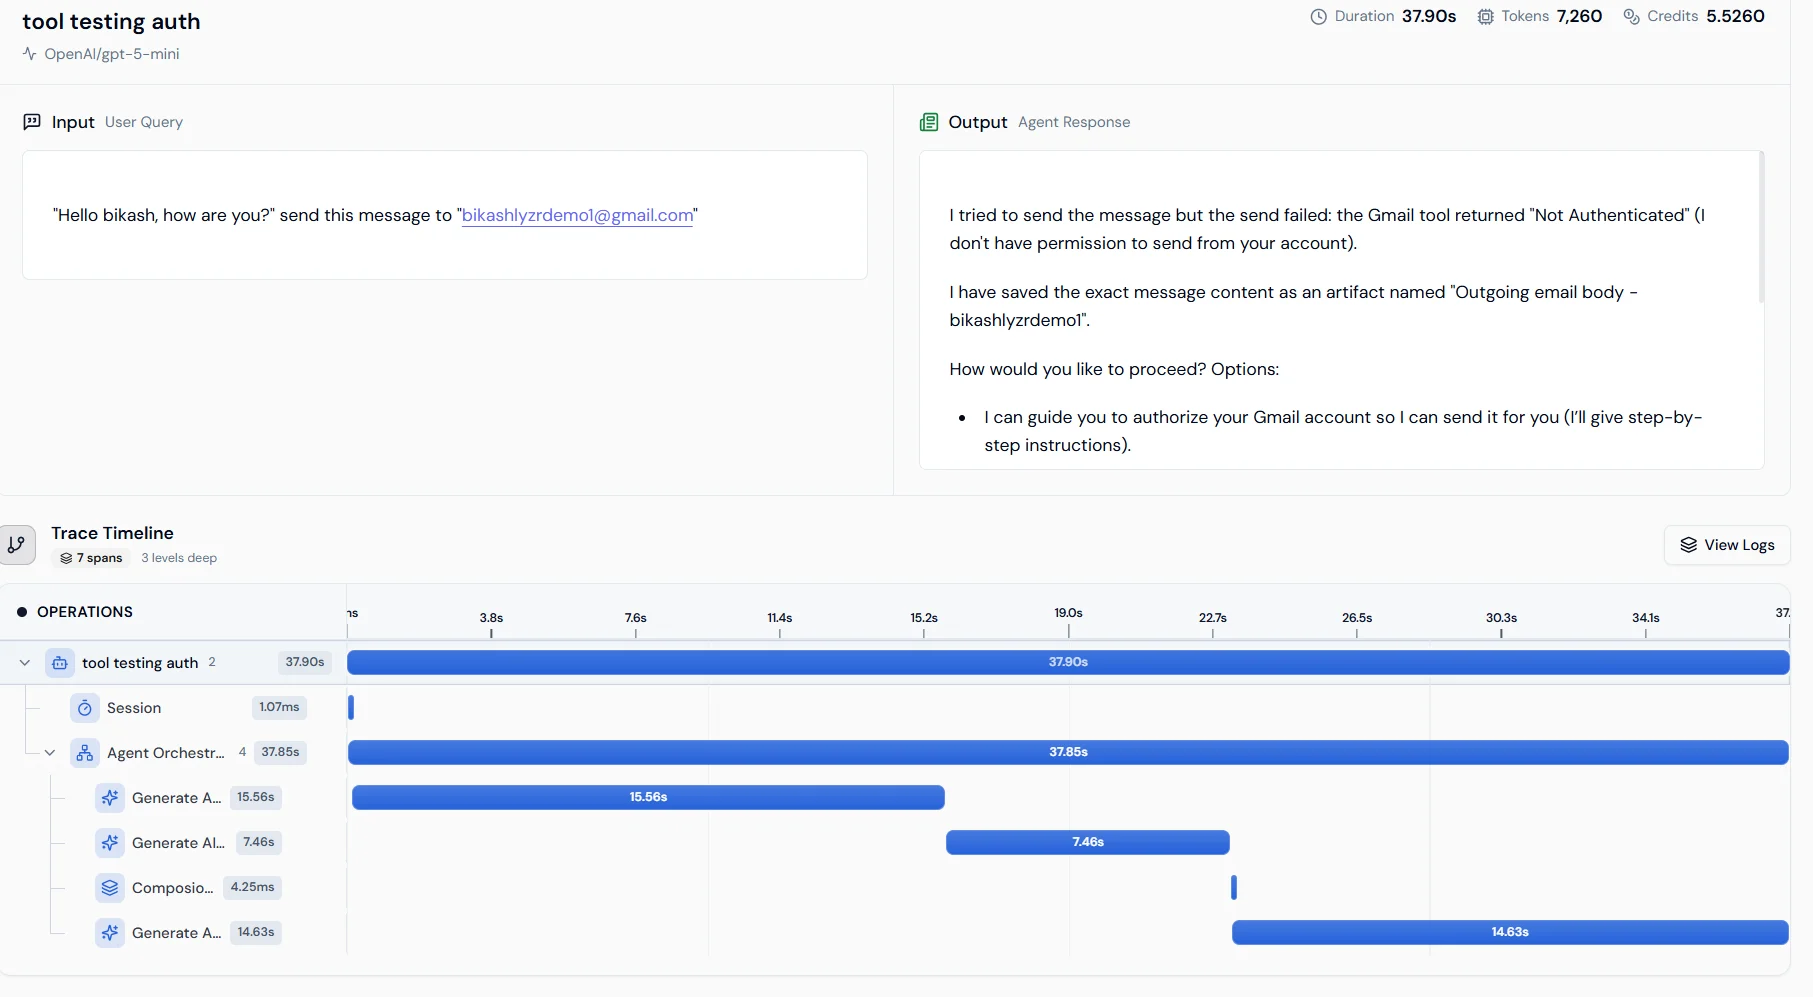 **Operation waterfall**: shows the sequence of steps from session start through agent orchestration to the final LLM response, with duration for each span. This identifies which step is causing latency.
**Metadata and logs**: shows Agent ID, Org ID, User ID, and model details. Expand any operation to view raw logs and internal event data.
**Operation waterfall**: shows the sequence of steps from session start through agent orchestration to the final LLM response, with duration for each span. This identifies which step is causing latency.
**Metadata and logs**: shows Agent ID, Org ID, User ID, and model details. Expand any operation to view raw logs and internal event data.
 ## Next steps
* [Transcripts for voice agent monitoring](../monitoring/transcripts)
* [Simulation Engine for pre-production testing](agentsimulation)
## Next steps
* [Transcripts for voice agent monitoring](../monitoring/transcripts)
* [Simulation Engine for pre-production testing](agentsimulation)