> ## Documentation Index
> Fetch the complete documentation index at: https://docs.lyzr.ai/llms.txt
> Use this file to discover all available pages before exploring further.
# Monitoring & Tracing
The **Monitoring and Tracing** section in Lyzr Studio provides real-time insights into agent usage, performance, and credit consumption. By standardizing traces with **OpenTelemetry**, we provide improved log quality, advanced filtering, and high-fidelity reporting to help teams maintain reliability at scale.
***
## 🔹 Monitoring Overview
Monitoring offers a dashboard view of **agent activity and system health**. With the move to **OpenTelemetry standardization**, the system provides higher-quality logs and more granular data points.
* **OpenTelemetry Standardization:** Improved log quality, filtering, and reporting accuracy.
* **Administrative Oversight:** Owners and Admins now have access to **all users’ data** for centralized monitoring.
* **Trace-level Status:** Immediate visibility into **success/failure status** to identify and fix issues faster.
 ***
## 🔹 Analytics Dashboard
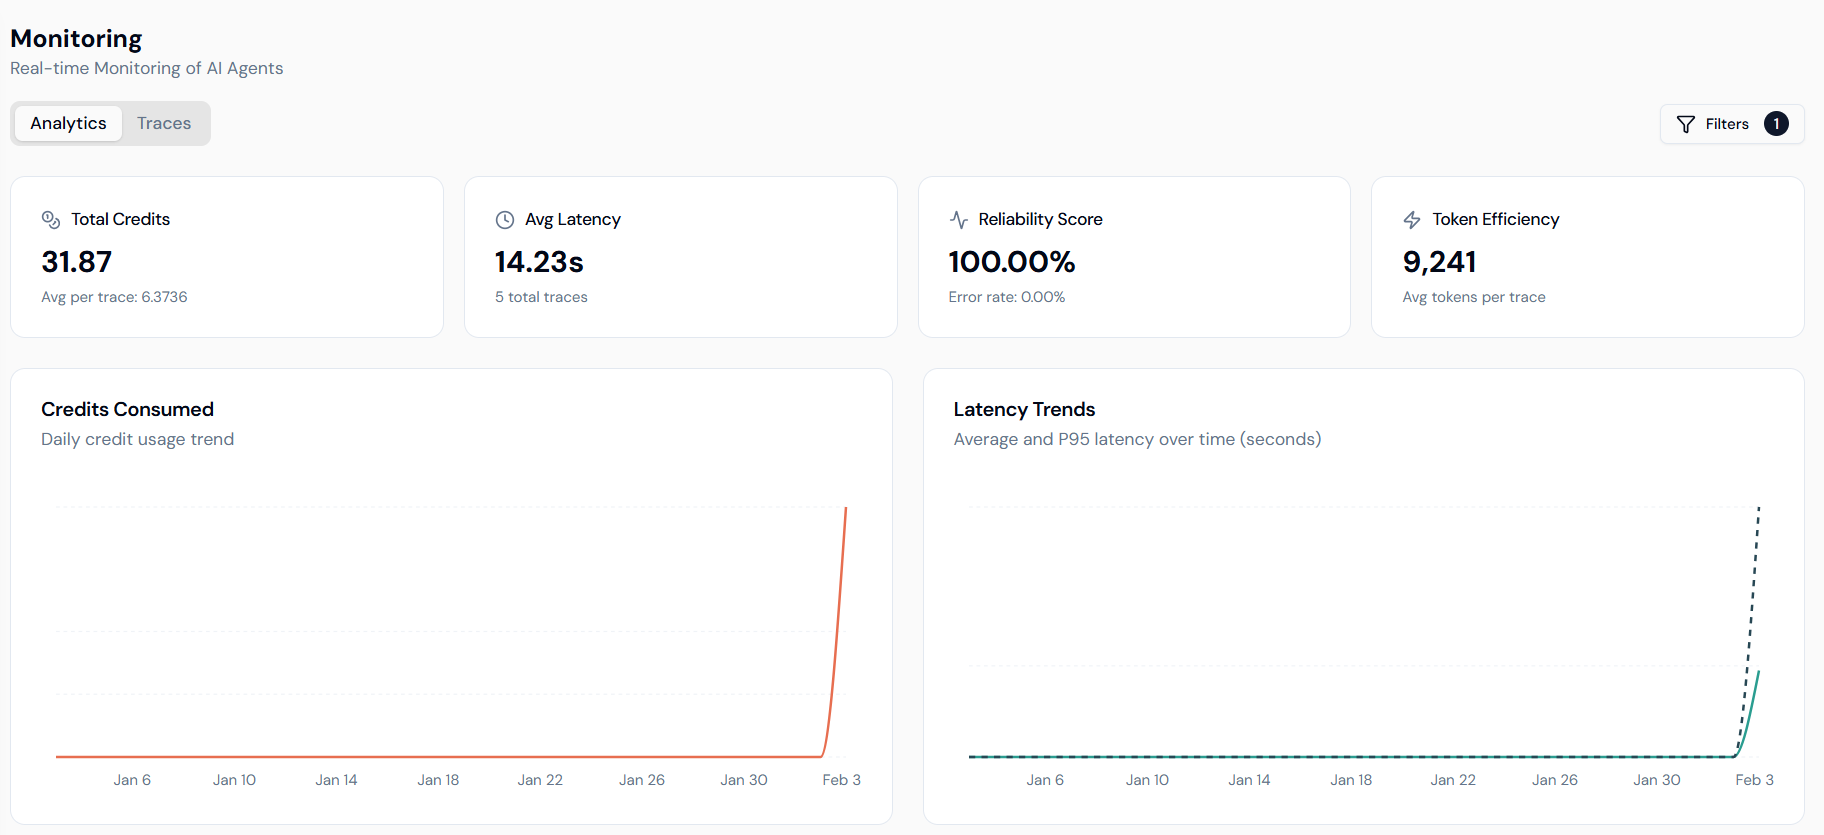
The **Analytics** tab provides high-level visualization of agent-wise usage metrics. We have introduced new charts to help you deeply analyze traces and uncover operational insights.
### **Key Metrics**
* **Total Credits:** Aggregate credits spent, including average cost per trace.
* **Avg Latency:** Mean response time of agents (in seconds).
* **Reliability Score:** Real-time percentage of successful executions (Error rate: 0.00%).
* **Token Efficiency:** Tracks average tokens used per trace to optimize LLM costs.
### **Performance Charts**
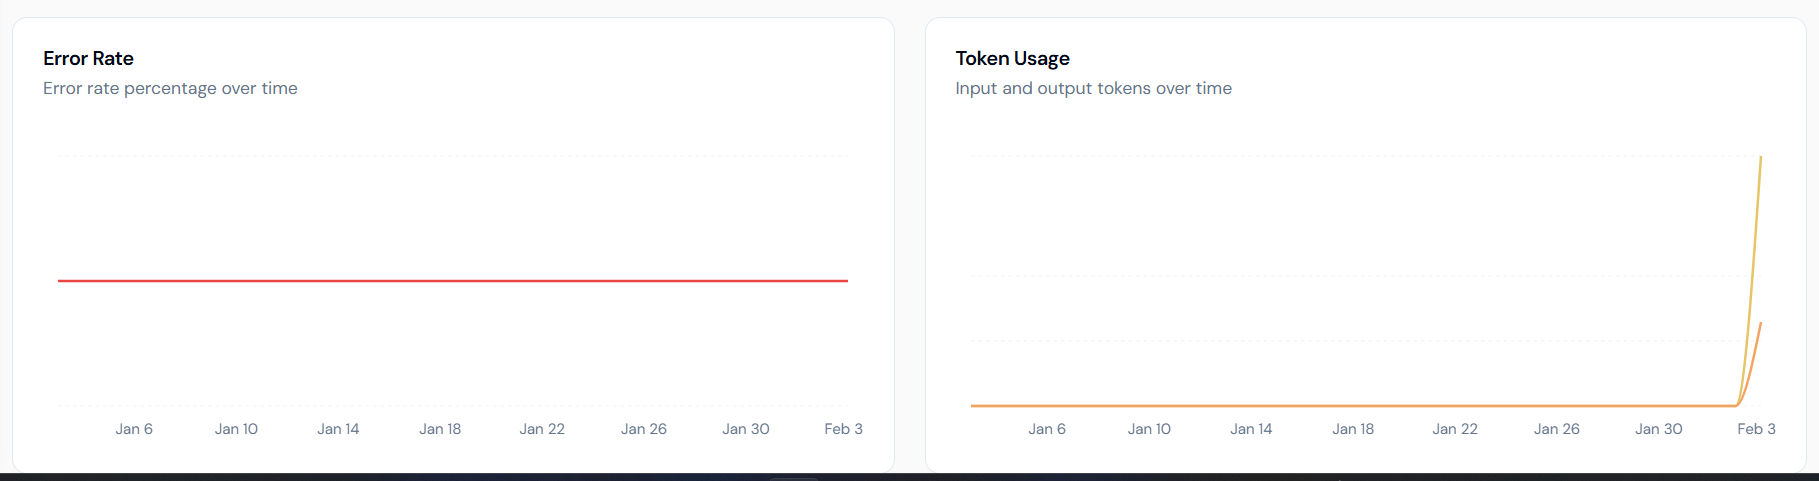
* **Error Rate:** A dedicated timeline visualizing the percentage of failures over time.
* **Token Usage:** Breakdown of input and output tokens to analyze model consumption.
* **Latency Trends:** Tracks both **Average and P95 latency** to identify performance bottlenecks.
* **Credits Consumed:** Daily credit usage trends for budget management.
***
## 🔹 Analytics Dashboard
The **Analytics** tab provides high-level visualization of agent-wise usage metrics. We have introduced new charts to help you deeply analyze traces and uncover operational insights.
### **Key Metrics**
* **Total Credits:** Aggregate credits spent, including average cost per trace.
* **Avg Latency:** Mean response time of agents (in seconds).
* **Reliability Score:** Real-time percentage of successful executions (Error rate: 0.00%).
* **Token Efficiency:** Tracks average tokens used per trace to optimize LLM costs.
### **Performance Charts**
* **Error Rate:** A dedicated timeline visualizing the percentage of failures over time.
* **Token Usage:** Breakdown of input and output tokens to analyze model consumption.
* **Latency Trends:** Tracks both **Average and P95 latency** to identify performance bottlenecks.
* **Credits Consumed:** Daily credit usage trends for budget management.
 ***
## 🔹 Tracing
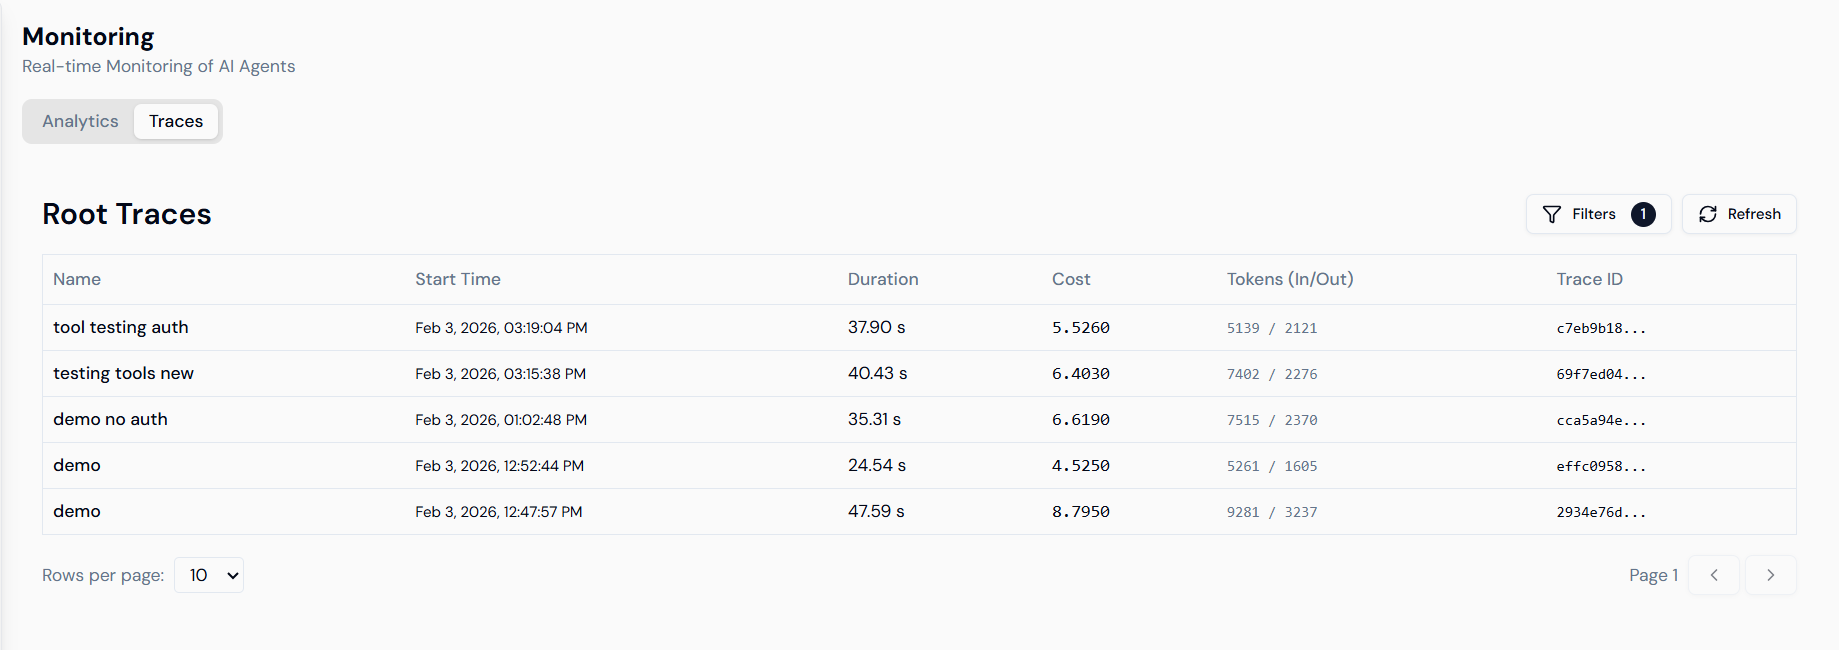
Switch to the **Traces** tab to see execution-level details of agents with fine-grained event logs.
### **Root Traces**
The traces view allows you to inspect every individual execution:
* **Trace ID:** Unique identifier for specific run tracking.
* **Duration:** Precise execution time for each request.
* **Cost & Tokens:** Real-time credit and token consumption for the specific trace.
* **Start Time:** Timestamp of execution.
***
## 🔹 Tracing
Switch to the **Traces** tab to see execution-level details of agents with fine-grained event logs.
### **Root Traces**
The traces view allows you to inspect every individual execution:
* **Trace ID:** Unique identifier for specific run tracking.
* **Duration:** Precise execution time for each request.
* **Cost & Tokens:** Real-time credit and token consumption for the specific trace.
* **Start Time:** Timestamp of execution.
 ### **Enhanced Filtering**
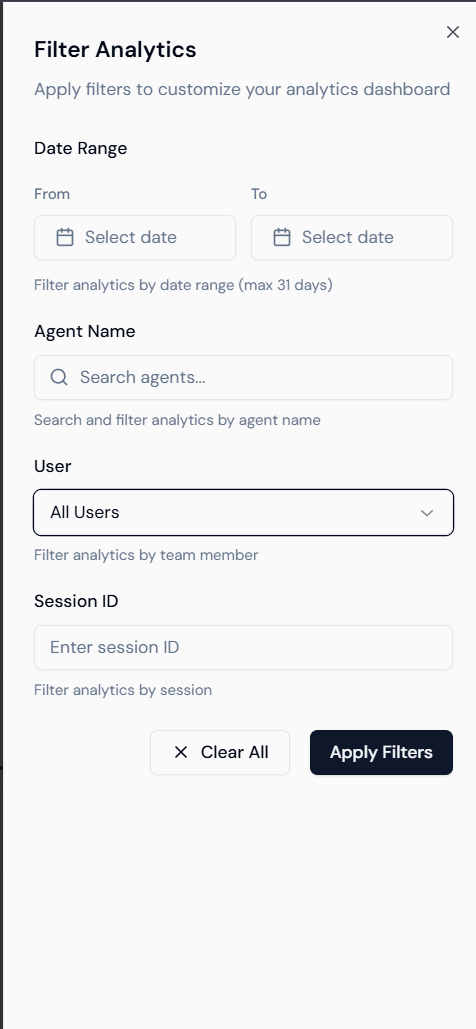
Use the **Filter Analytics** sidebar to drill down into data by:
* **Date Range:** Select specific windows (max 31 days).
* **Agent Name:** Filter by specific AI agents.
* **User:** Admins can filter by specific team members.
* **Session ID:** Isolate traces belonging to a single session.
### **Enhanced Filtering**
Use the **Filter Analytics** sidebar to drill down into data by:
* **Date Range:** Select specific windows (max 31 days).
* **Agent Name:** Filter by specific AI agents.
* **User:** Admins can filter by specific team members.
* **Session ID:** Isolate traces belonging to a single session.
 ***
## 🔹 Debugging & Detailed Logs
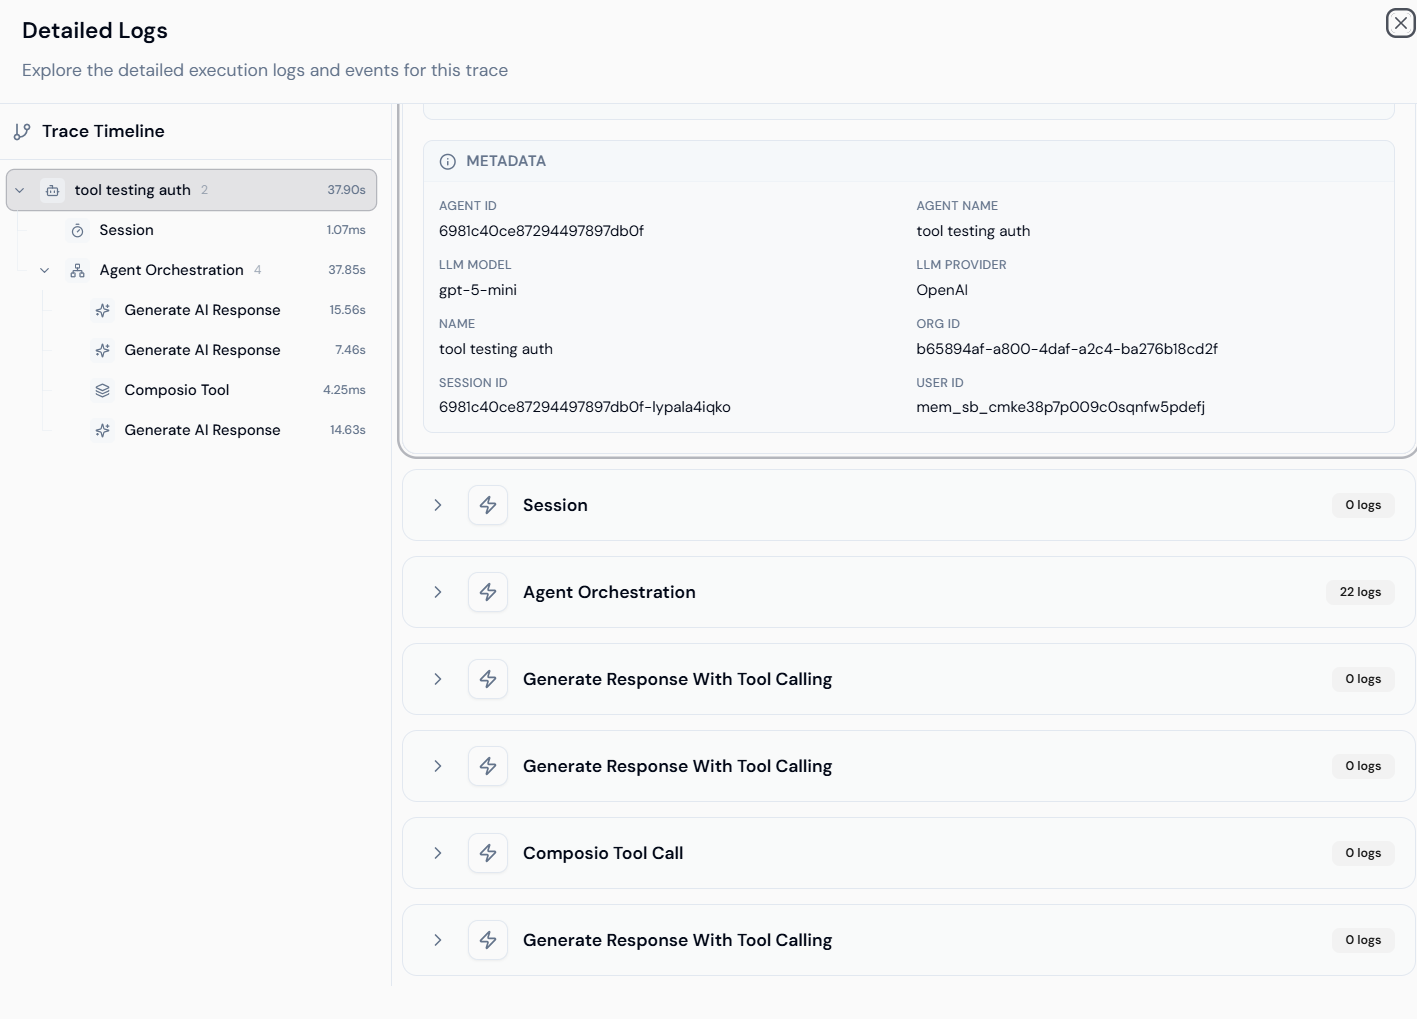
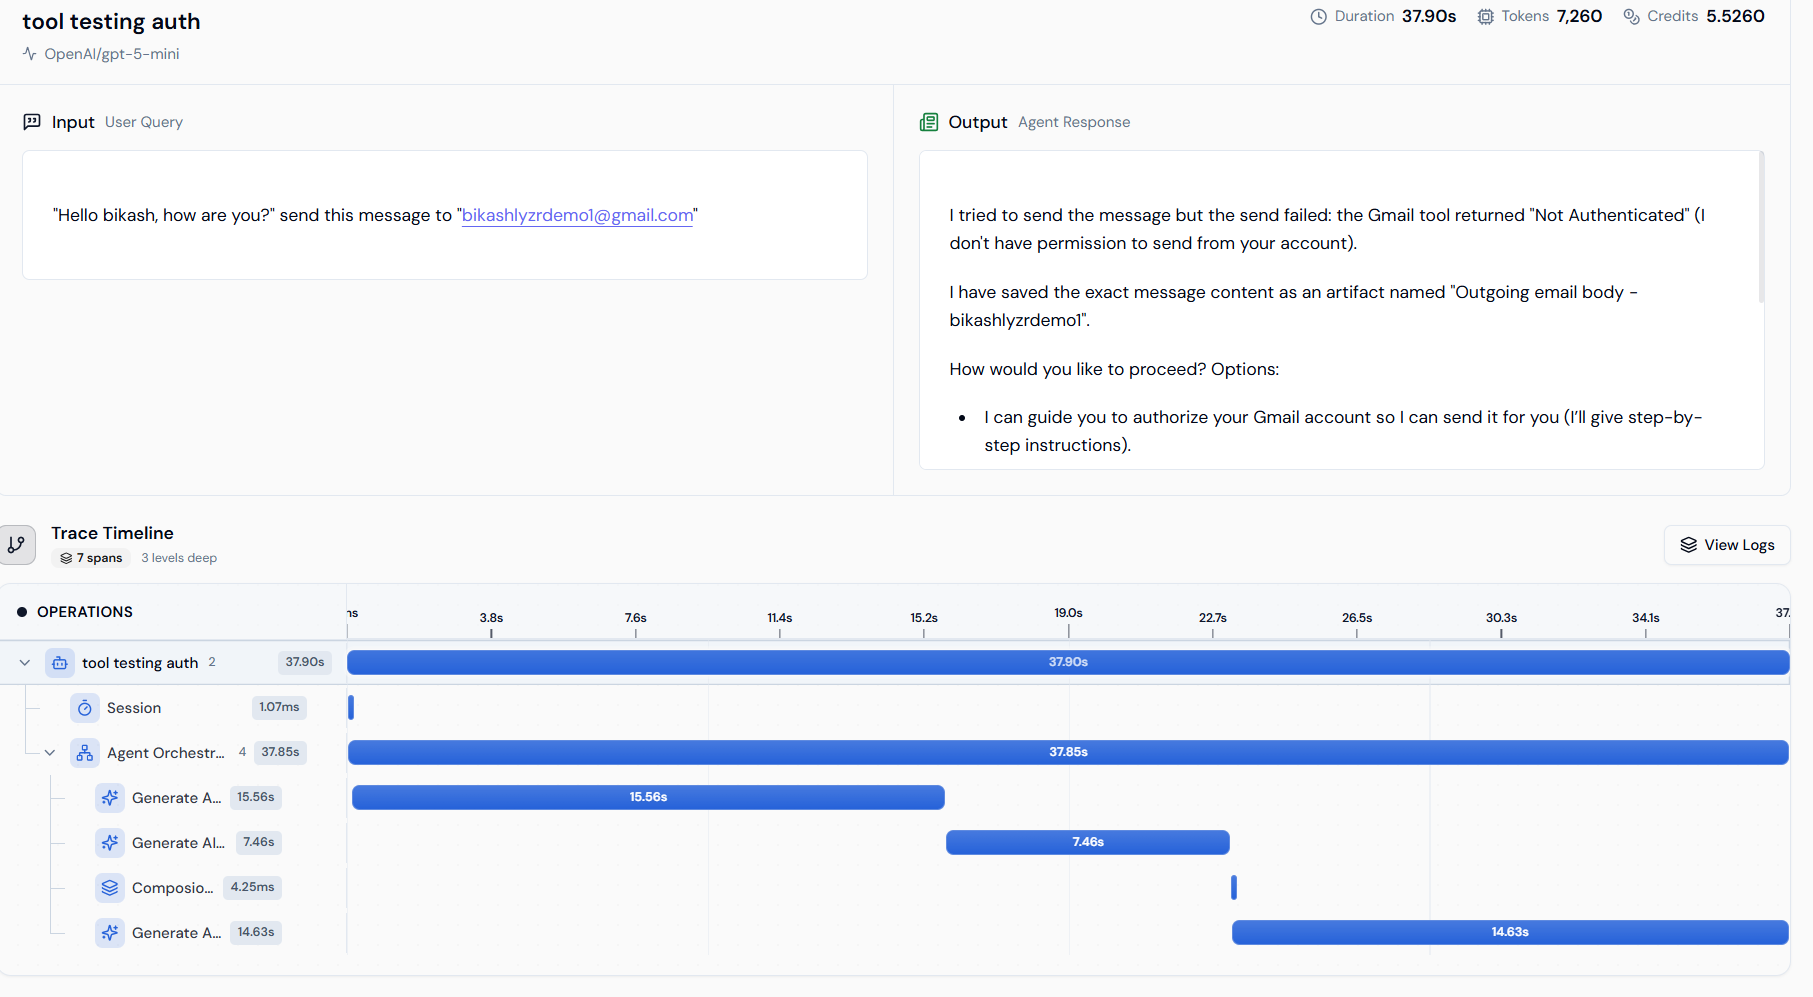
Clicking any trace opens a deep-dive view into the agent's internal operations, which is essential for validating tool calls and responses.
### **Trace Timeline**
* **Operation Waterfall:** See the sequence of events from `Session` start to `Agent Orchestration` and `Generate AI Response`.
* **Span Duration:** Identify exactly which step (e.g., a specific tool call) is causing latency.
***
## 🔹 Debugging & Detailed Logs
Clicking any trace opens a deep-dive view into the agent's internal operations, which is essential for validating tool calls and responses.
### **Trace Timeline**
* **Operation Waterfall:** See the sequence of events from `Session` start to `Agent Orchestration` and `Generate AI Response`.
* **Span Duration:** Identify exactly which step (e.g., a specific tool call) is causing latency.
 ### **Detailed Metadata & Logs**
* **Metadata:** Access Agent ID, Org ID, User ID, and specific LLM model details (e.g., `gpt-5-mini`).
* **Execution Logs:** Expand individual operations to view raw logs and internal event data.
### **Detailed Metadata & Logs**
* **Metadata:** Access Agent ID, Org ID, User ID, and specific LLM model details (e.g., `gpt-5-mini`).
* **Execution Logs:** Expand individual operations to view raw logs and internal event data.